
Venn Diagram Example
Loading the math board and drawing, please wait…
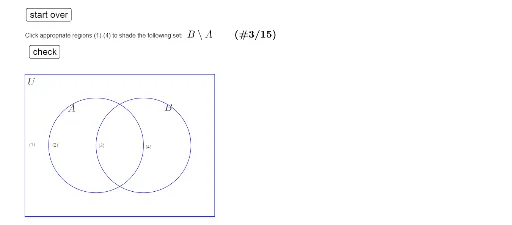
This example demonstrates how to draw Venn diagrams using GeoGebra, illustrating relationships between sets. Core math concepts include set theory, logical operations, and geometric construction. Key GeoGebra commands/objects used are Polygon, If, Segment, Element, and Length for constructing the diagrams. Suitable for high school mathematics students and teachers for instructional demonstration and concept understanding.
GeoGebra Commands & Parameters
Polygon(corner) → poly1If(clr1, 0, 1) → RG1If(clr4, 0, 1) → RG4If(clr3, 0, 1) → RG3If(clr2, 0, 1) → RG2Polygon(Corner[1], Corner[2], Corner[3], Corner[4]) → poly2, e, f, g, hSegment(Element[corner, 1], Element[corner, 2]) → aSegment(Element[corner, 2], Element[corner, 3]) → bSegment(Element[corner, 3], Element[corner, 4]) → cSegment(Element[corner, 4], Element[corner, 1]) → dElement(problem, prnr, 1) → settextLength(problem) → length
AI Drawing Prompt Reference
Draw a Venn diagram to illustrate the relationships between sets, using polygons to represent each set and different colors to distinguish them, start by drawing the first set's polygon, then set colors based on conditions, next draw the second set's polygon, and finally connect the vertices to form a closed shape, labeling the set names and length information.
The prompt above was compiled from the original drawing commands and is for reference only.