
Vectors and Ellipse with Logarithmic Transformations
Loading the math board and drawing, please wait…
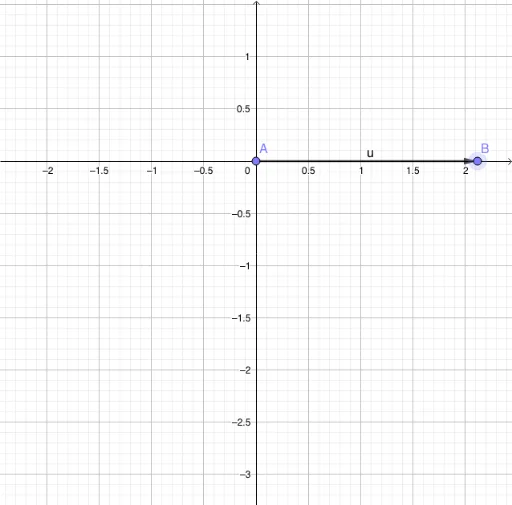
This GeoGebra example demonstrates a composite mathematical scene combining vectors, an ellipse, logarithmic functions, geometric transformations, and a cylinder. It shows how to define points A and B using the Point command, create vector u with the Vector command, and then overlay an ellipse, logarithmic function graphs, and a cylindrical surface in the same coordinate system. The core concepts involve vector representation and operations, parametric equations of ellipses, properties of logarithmic functions, and geometric transformations such as translation and scaling. The construction uses basic GeoGebra commands: Point for A and B, and Vector for u, which serve as foundational elements for building the rest of the visualization. This example is suitable for high school or early college students to explore the interplay between vectors and function graphs, and to understand spatial relationships among different mathematical objects. It also serves as an effective teaching tool for demonstrating vector transformations and function superposition in an interactive environment.
GeoGebra Commands & Parameters
Point(xAxis) → APoint(xAxis) → BVector(A, B) → u
AI Drawing Prompt Reference
Draw a vector with a starting point on the x-axis and an ending point on the x-axis, then plot an ellipse based on these two points, overlay logarithmic function graphs on the same coordinate system, and finally display a cylinder to illustrate the relationship between vectors, ellipses, logarithmic functions, and geometric transformations.
The prompt above was compiled from the original drawing commands and is for reference only.