
Vector Addition Visualization with GeoGebra
Loading the math board and drawing, please wait…
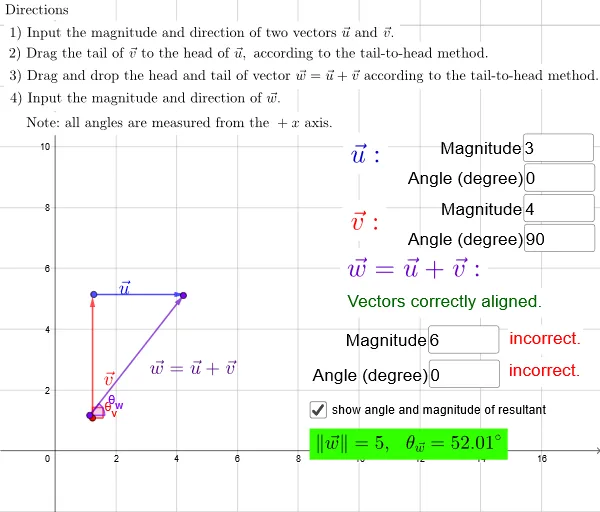
This GeoGebra example dynamically illustrates vector addition by connecting two vectors head-to-tail and displaying the resultant vector in real time. Core mathematical concepts include vector addition, the parallelogram law, and coordinate-based component computation. Construction utilizes GeoGebra commands such as Vector, Length, Angle, and Textfield, along with points, vectors, and labels to enable interactive adjustment of vector magnitudes and directions. It is suitable for high school mathematics vector units, calculus preparation, or anyone exploring geometric vector operations visually.
GeoGebra Commands & Parameters
Textfield(r1) → r1InputTextfield(t1) → r2Input_1Angle(ABangPoint, A, B) → ABangVector(A, B) → uTextfield(r2) → r2InputTextfield(t2) → t2InputVector(C, D) → vLength(u) → normuLength(v) → normvTextfield(r1) → r1Input_1Textfield(t1) → r2Input_2Vector(A_1, B_1) → u_1Length(u_1) → normu_1Angle(CDangPoint, C, D) → CDangVector(E, F) → wLength(w) → normwAngle(EFangPoint, E, F) → t3Textfield(ansnormw) → InputBox1Textfield(anst3) → InputBox2
AI Drawing Prompt Reference
Draw a dynamic vector addition diagram. Include two vectors that are connected head-to-tail to form a triangle. Also show a resultant vector representing the sum of the two vectors. Allow adjustment of vector lengths and directions. The diagram should clearly illustrate the concept of vector addition, suitable for math teaching or geometry learning.
The prompt above was compiled from the original drawing commands and is for reference only.