
Useful Ratios and Charts
Loading the math board and drawing, please wait…
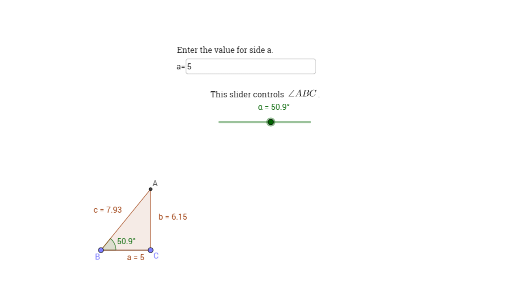
This example demonstrates how to use GeoGebra to create pie charts and circle charts related to ratios, showcasing the application of rational numbers, linear functions in distributions. Core math concepts include ratios, circles, rational numbers, linear functions, distributions, and quadrilaterals. Construction highlights involve commands like Intersect, Point, Line, OrthogonalLine, Segment, Textfield, Rotate, Angle, Polygon. Suitable for middle school and above, focusing on understanding the connection between ratios, charts, and geometric constructions.
GeoGebra Commands & Parameters
Intersect(xAxis, yAxis) → A_1Point(xAxis) → CLine(A_1, C) → fOrthogonalLine(C, f) → gPoint(Circle[C, a_2]) → BSegment(C, B) → hTextfield(a_2) → InputBox1Rotate(C, α, B) → B'Angle(C, B, B') → βLine(B, B') → iIntersect(g, i) → APolygon(B, C, A) → poly1, a, b, c
AI Drawing Prompt Reference
Draw a combination of a circle and a square. Start by marking the intersection of the x-axis and y-axis as point A, then draw a line f through the origin. Draw a line g perpendicular to f and passing through point C, and select a point B on the circle with center C. Connect CB and input a value a2 in the text field. Rotate point C around point B to get point B', calculate the angle ∠CBB' as β, and draw line BB'. Find the intersection of g and BB' as point A, and finally draw a triangle with points B, C, and A.
The prompt above was compiled from the original drawing commands and is for reference only.