
US Coronavirus Cases till 29-05-2020
Loading the math board and drawing, please wait…
In collections
Confirmed Coronavirus Cases in Countries
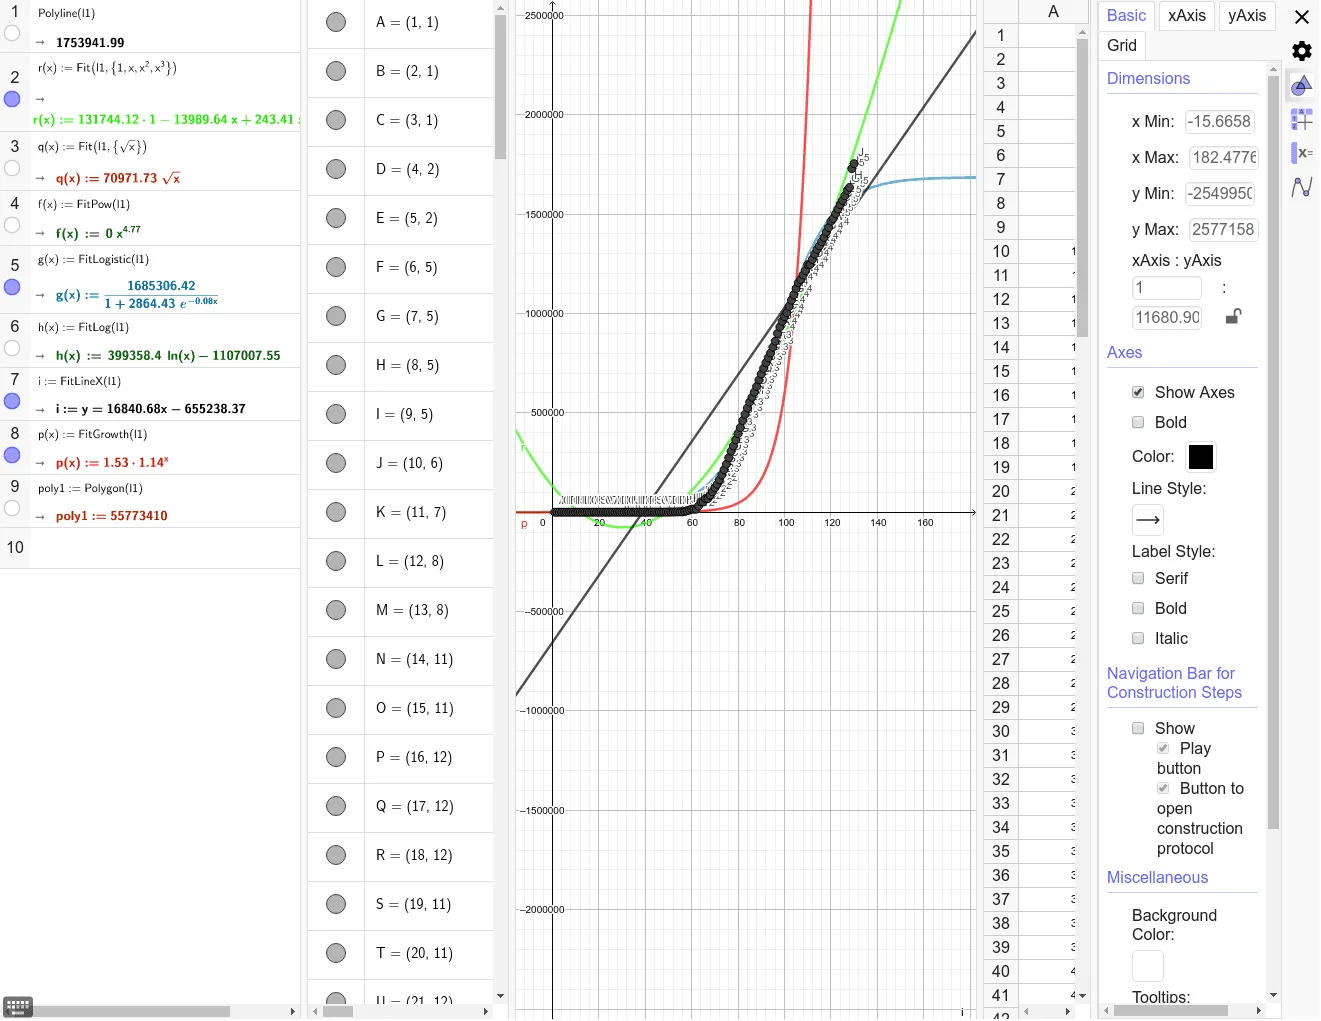
This example illustrates the number of coronavirus cases in the United States up to May 29, 2020. It involves statistical data visualization and the concept of arithmetic mean. Using GeoGebra objects like A1, B1, A2, B2, etc., the growth trend of cases can be visually observed. Suitable for high school or university statistics courses to help students understand data visualization and analysis.
GeoGebra Commands & Parameters
11213142526575859510611712813814111511161217121812191120112112221323142415251526132713281529153015