
Units in Scale Drawings: IM 7.1.12 Lesson
Loading the math board and drawing, please wait…
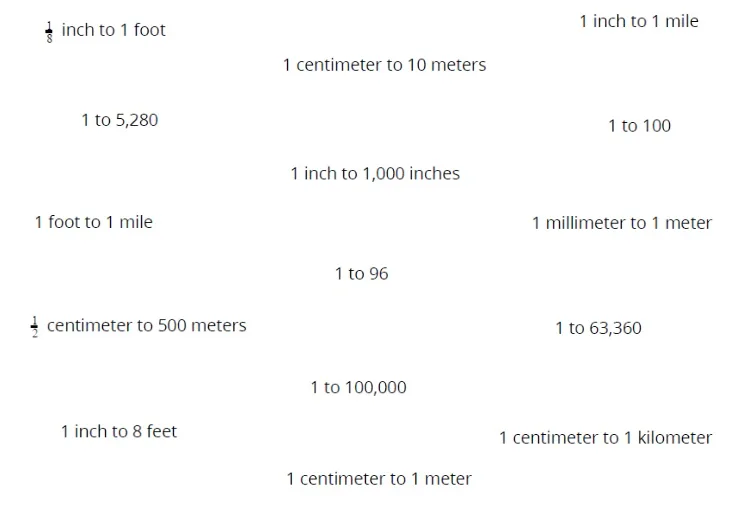
This GeoGebra example demonstrates how to understand and convert units in scale drawings. It uses multiple image objects (pic1 through pic13) paired with points (A, B, C, etc.) to visually show the relationship between actual dimensions and scaled dimensions on a drawing. The core mathematical concepts include scale factor, unit conversion, proportional reasoning, and measurement. The construction involves inserting images into the GeoGebra canvas and placing points to mark key locations, allowing users to adjust image sizes and point coordinates to explore scaling effects. This resource is ideal for middle school (Grade 7) students learning about scale drawings and unit conversion, and can be used for classroom demonstration or independent exploration.
GeoGebra Commands & Parameters
Point A(-6.6932089492600015, 8.159090165195815)Point B(0.2279910507400078, 8.159090165195815)Point C(-14.509684347693064, 0.13354591013411118)Point D(-7.109324347693056, 0.13354591013411118)Point E(-6.518147217055431, -4.549569593294154)Point F(-0.2358272170554263, -4.549569593294154)Point G(-13.972730653205593, 9.265181421614184)Point H(-9.607050653205587, 9.265181421614184)Point I(1.016343753917286, 3.381311688347133)Point J(7.165563753917294, 3.381311688347133)Point K(-5.439307816383173, 1.9222407574560347)Point L(-2.32476781638317, 1.9222407574560347)Point M(-0.0015852785370087386, -3.4938145882187905)Point N(7.292294721462995, -3.4938145882187905)Point O(2.7933305115347, 6.518299285177537)Point P(6.706470511534699, 6.518299285177537)Point Q(-6.9062597535619705, 4.8006549061088215)Point R(-0.2778797535619604, 4.8006549061088215)Point S(-13.30955113202862, 6.6696296666741235)Point T(-9.449651132028615, 6.6696296666741235)Point U(-14.477311913826762, 3.379301702466864)Point V(-9.685711913826758, 3.379301702466864)Point W(1.4431564656044267, 0.18894688783053615)Point Z(5.48939646560443, 0.18894688783053615)Point A_1(2.3567228994967895, 9.666309240653563)Point B_1(7.095082899496797, 9.666309240653563)Point C_1(-6.1943819028220535, -1.7255355046260525)Point D_1(-1.6157419028220488, -1.7255355046260525)Point E_1(-13.914087817633098, -3.0349346707254763)Point F_1(-8.882907817633093, -3.0349346707254763)
AI Drawing Prompt Reference
Create a diagram for teaching scale drawings, showing multiple pairs of points scattered across the canvas. Each pair represents corresponding actual and scaled measurements, arranged in horizontal or slightly tilted alignments. The points are unconnected, emphasizing positional comparison for unit conversion. Keep the layout sparse with white space, using only dots to suggest proportional relationships.
The prompt above was compiled from the original drawing commands and is for reference only.