
Unit Circle with Sine, Cosine, and Tangent Dynamic Visualization
Loading the math board and drawing, please wait…
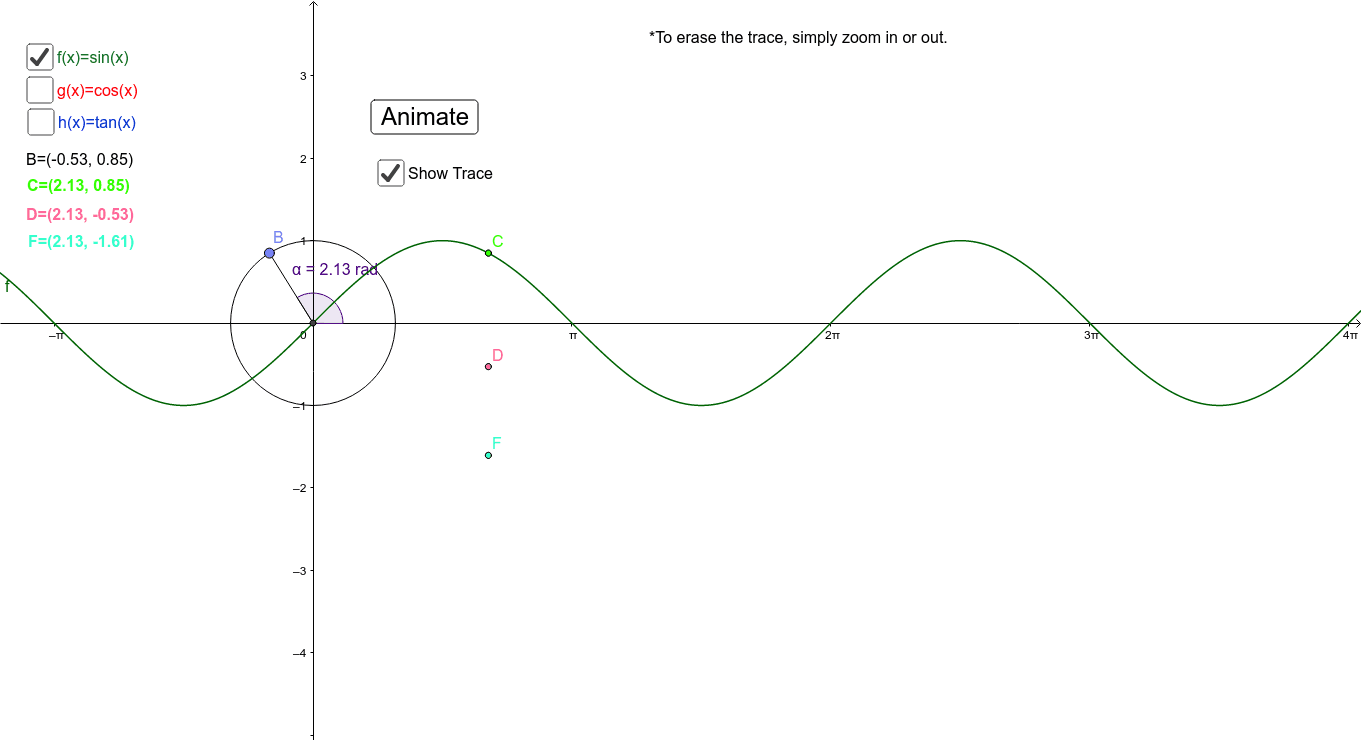
This GeoGebra example dynamically illustrates the geometric meanings of sine, cosine, and tangent on the unit circle as the angle changes. It demonstrates how the coordinates of a point on the unit circle correspond to cosine and sine, while the tangent is represented by the length of a segment along the tangent line at (1,0). The construction uses commands such as Intersect, Circle, Point, Angle, OrthogonalLine, and Segment to build the circle, the rotating radius, the perpendicular projections, and the tangent segment. Animated sliders or buttons allow users to explore angle variations and observe how the three trigonometric ratios change. This resource is ideal for high school trigonometry lessons, helping students connect the unit circle definition to the graphs of sine, cosine, and tangent, and for reinforcing concepts like periodicity and quadrant signs.
GeoGebra Commands & Parameters
Intersect(xAxis, yAxis) → ACircle(A, 1) → dIntersect(d, xAxis, 2) → EPoint(d) → BAngle(E, A, B) → αOrthogonalLine(B, xAxis) → iSegment(A, B) → j