
Cartesian Parabola: Secants and Locus Exploration
Loading the math board and drawing, please wait…
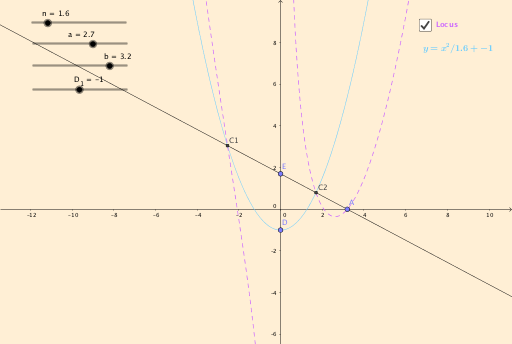
This GeoGebra example demonstrates the construction of a Cartesian parabola and the generation of related secant lines and loci. The core mathematical concepts include parabolas, secant lines, intersection points, integer parameters, and cubic relationships, bridging analytic geometry and function graphing. Construction highlights: using the Line command to draw straight lines, the Intersect command to find intersection points, and the Locus command to generate trajectories; objects include n, D_1, c, D, a, E, b, A, f, C1, C2, loc1, loc2, text1, d, and text2, with slider n controlling integer changes to dynamically show secant positions and locus shapes. Suitable for high school or early college students to understand parabola properties, secant slope variations, and locus equation derivation, and also useful as a hands-on exploration of parametric geometric relationships in math lab sessions.
GeoGebra Commands & Parameters
Line(E, A) → fIntersect(c, f, 2) → C1Intersect(c, f, 1) → C2Locus(C1, D_1) → loc1Locus(C2, D_1) → loc2
AI Drawing Prompt Reference
Draw a parabola and generate two intersecting lines on it. The intersection points of these lines with the parabola move as a slider parameter changes, forming two locus curves that are the paths traced by lines connecting the moving points to a fixed point.
The prompt above was compiled from the original drawing commands and is for reference only.