
Unit Circle Visualization
Loading the math board and drawing, please wait…
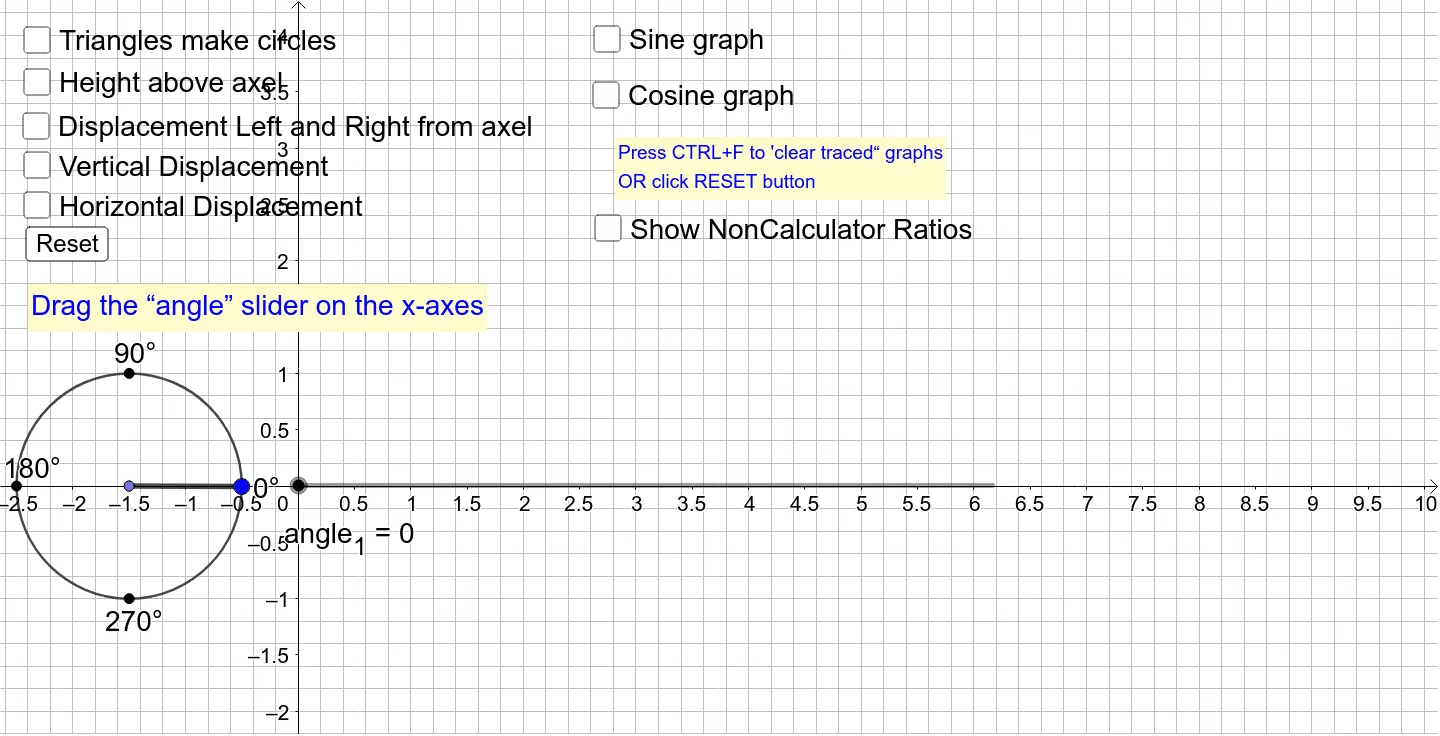
This example visualizes the unit circle, involving core concepts of trigonometry and coordinate geometry. Using GeoGebra commands such as Point, Rotate, Segment, Angle, it dynamically shows the relationship between points on the unit circle and their angles and radians. Suitable for high school math education and learning.
GeoGebra Commands & Parameters
Point(c) → ARotate(B, angle_1, B) → B'Rotate(A, angle_1, B) → A'Segment(B', A') → f'Segment(V, A') → vSegment(B, V) → hSegment(D, B) → fSegment(E, B) → gSegment(F, B) → iSegment(I, B) → jSegment(H, B) → kSegment(G, B) → lSegment(J, B) → mSegment(K, B) → nSegment(L, B) → pSegment(O, B) → qSegment(A', B) → rSegment(M, B) → sSegment(B, N) → tSegment(A', S) → VerticalHeightAngle(A, B, A') → angleSegment(A', V) → v_1Segment(B, V) → h_2Segment(V, A') → YSegment(B, V) → XSegment(A', S_2) → VertHeight2Segment(B, V) → h_3
AI Drawing Prompt Reference
Draw a unit circle with a point on it. Connect this point to the center of the circle. Then, create an angle from the center using the line segment, and mark another point on the angle. Draw line segments to show the relationships between these points, including vertical and horizontal distances. Use arcs to represent angles and dynamically illustrate the connection between trigonometry and coordinate geometry.
The prompt above was compiled from the original drawing commands and is for reference only.