
Unit Circle and Trigonometric Function Graphs
Loading the math board and drawing, please wait…
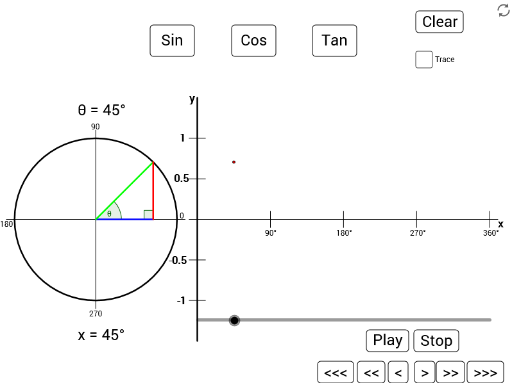
This example demonstrates how a point moving on the unit circle generates the graphs of sine, cosine, and tangent functions, illustrating the geometric foundation of trigonometry. Core mathematical concepts include the unit circle definition, trigonometric functions (sin, cos, tan), angle measurement in radians and degrees, coordinate relationships, and dynamic function graphing. The construction uses GeoGebra commands Point, Circle, Segment, Intersect, Rotate, and Angle, with objects such as X, A, c, I, K, f, N, B, D, α, C, θ, h, F, G, j, H, J, L, M, i, k, sin_b, cos_b, tan_b, θ_t, and coordinate pairs x_i, y_i. By rotating points on the circle and computing intersections, the example plots trigonometric values and visualizes their corresponding function curves. It is suitable for high school mathematics (trigonometry units), classroom demonstrations, and independent inquiry, helping learners build an intuitive connection between circular motion and function graphs.
GeoGebra Commands & Parameters
Point({-125, 0}) → ACircle(A, 100) → cSegment(K, I) → fIntersect(c, f, 2) → NRotate(N, X°, A) → N'Point(c) → BIntersect(xAxis, yAxis) → DAngle(D, A, B) → αPoint({x(N'), 0}) → CAngle(C, A, N') → θSegment(C, A) → hSegment(F, G) → jSegment(L, M) → iSegment(H, J) → kSegment(x_1, x_2) → lSegment(x_3, x_4) → mSegment(x_5, x_6) → nSegment(x_7, x_8) → pSegment(y_7, y_8) → qSegment(y_3, y_4) → rSegment(y_1, y_2) → sSegment(y_5, y_6) → tAngle(N, A, N') → γSegment(A, N') → f_1Segment(N', C) → gAngle(A, C, N') → βPoint({γ / °, (100 * sin(γ))}) → E
AI Drawing Prompt Reference
Draw a unit circle centered on the left with a fixed radius, place a movable point on its circumference, draw the radius to that point and measure the angle it makes with the positive x‑axis; drop perpendiculars from the point to the x‑ and y‑axes to form the sine and cosine segments, and extend the radius to meet the vertical line through the circle’s rightmost point to obtain the tangent segment; then plot points whose horizontal coordinate is the angle (in degrees or radians) and vertical coordinates are the corresponding sine, cosine, and tangent values scaled by the radius, connecting them into three dynamic curves that illustrate how circular motion generates the trigonometric function graphs.
The prompt above was compiled from the original drawing commands and is for reference only.