
Unit Circle and Tangent Graph by Becky Angus
Loading the math board and drawing, please wait…
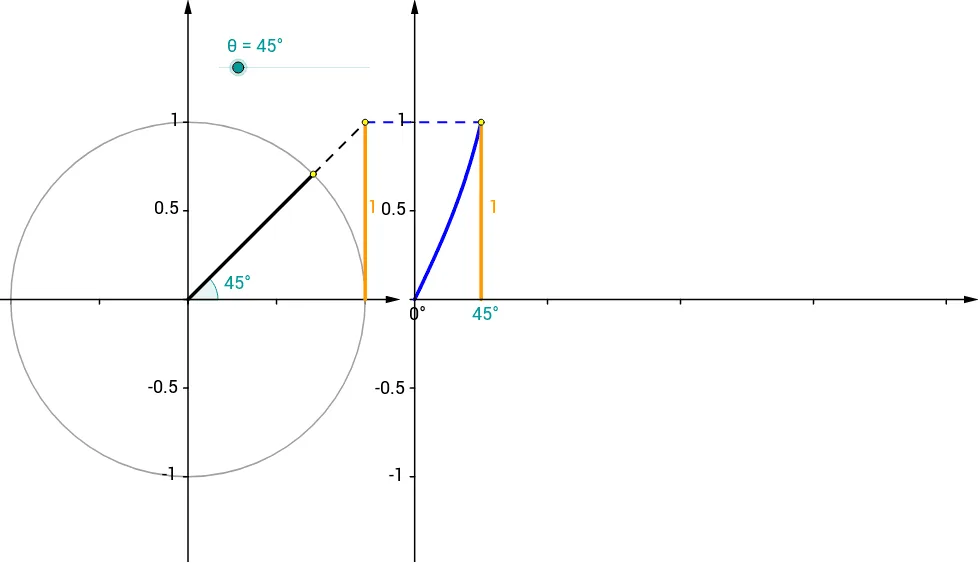
This example demonstrates the cosine function graph using the unit circle and shows the tangent function's characteristics. Key mathematical concepts include trigonometric functions, unit circle, periodicity, and tangent properties. Construction involves GeoGebra commands like Point, Rotate, Circle, etc. Suitable for high school students learning trigonometry basics or for math teaching demonstrations.
GeoGebra Commands & Parameters
Point(Ray[(0, 0), (-1, 0)]) → BRotate(A, θ, B) → PSegment(A, Intersect[Line[B, P], x = x(A)]) → hSegment(P, Intersect[Line[B, P], x = x(A)]) → gRotate(A, θ, B) → A'Angle(A, B, A') → αRotate(A, θ, B) → A'_1Angle(A, B, A'_1) → βSegment(Q, (x(Q), 0)) → eCircle(B, A) → cSegment(B, P) → aVector((x(B), y(Corner[1])), (x(B), y(Corner[4]))) → uVector((0, y(Corner[1])), (0, y(Corner[4]))) → wVector((0, 0), (x(Corner[2]), 0)) → zSequence(Segment[(0.75 * i, 0), (0.75 * i, -0.025)], i, 1, 4) → list1Vector(B - (1.2, 0), B + (1.2, 0)) → vSequence(Segment[(0, 0.5 * i - 1), (-0.025, 0.5 * i - 1)], i, 0, 4) → list2Sequence(Segment[(x(B), 0.5 * i - 1), (x(B) - 0.025, 0.5 * i - 1)], i, 0, 4) → list3Sequence(Segment[B + (0.5 * i - 1, 0), B + (0.5 * i - 1, -0.025)], i, 0, 4) → list4Segment(C, Q) → dFunction(tan(120° * x), 0, θ / (360 * γ) * 3) → fPoint(Ray[(0, 0), (-1, 0)]) → B_1Rotate(A_1, θ, B_1) → P_1Rotate(A_1, θ, B_1) → A'_2Rotate(A_1, θ, B_1) → A'_3Circle(B_1, A_1) → c_1
AI Drawing Prompt Reference
Draw a unit circle and display the cosine function graph. Create a point on a ray extending left from the origin, then rotate this point around the origin to form points on the unit circle. Connect these points to the origin and draw vertical line segments to show the cosine function values. Also, plot the tangent function graph and label key angles and segments to demonstrate the properties of the tangent function.
The prompt above was compiled from the original drawing commands and is for reference only.