
Unit Circle and Sine Wave 2
Loading the math board and drawing, please wait…
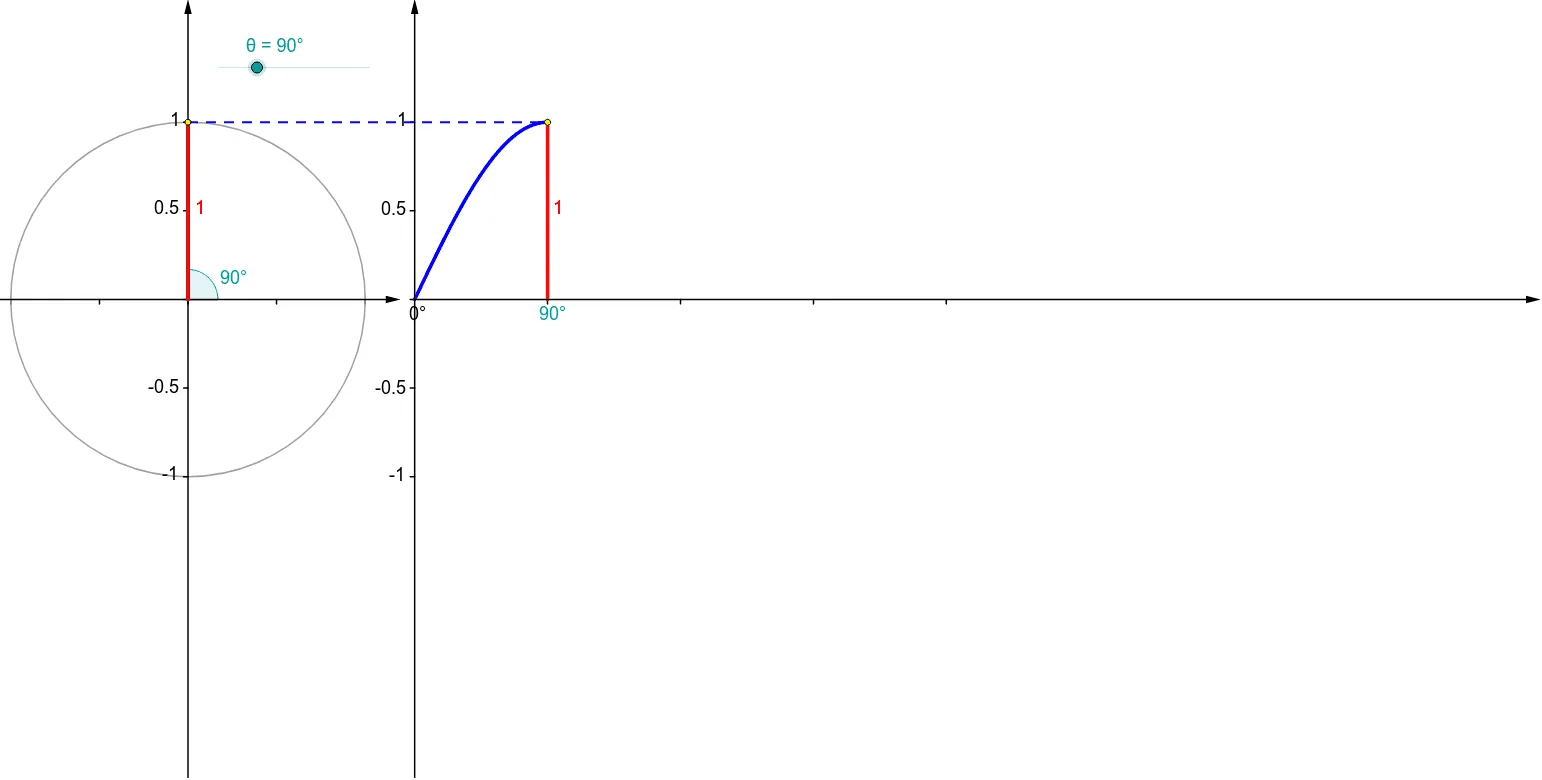
① This example dynamically demonstrates how the sine function graph is generated from circular motion by a rotating point on the unit circle, producing a continuous sine wave. ② Core mathematical concepts include the unit circle definition, trigonometric functions (sine), angle-radian correspondence, periodicity, and the linkage between geometric figures and function graphs. ③ Construction highlights: using GeoGebra commands such as Point, Rotate, Angle, Function, Segment, Circle, Vector, and Sequence, it builds the unit circle, rotating angle θ, moving point P and its projection, and generates a sequence of points on the sine wave, while incorporating triangles, tangent lines, bar charts, and other elements to show multiple correspondences among angles, side lengths, and function values. ④ Suitable for high school trigonometry teaching, pre-calculus review, and math enthusiasts exploring the intuitive connection between functions and geometric transformations, as well as for creating dynamic presentation materials.
GeoGebra Commands & Parameters
Point(Ray[(0, 0), (-1, 0)]) → BRotate(A, θ, B) → PRotate(A, θ, B) → A'Angle(A, B, A') → αRotate(A, θ, B) → A'_1Angle(A, B, A'_1) → βFunction(sin((120° * x)), 0, x(Q)) → fSegment(Q, (x(Q), 0)) → eCircle(B, A) → cSegment(B, P) → aVector((x(B), y(Corner[1])), (x(B), y(Corner[4]))) → uVector((0, y(Corner[1])), (0, y(Corner[4]))) → wVector((0, 0), (x(Corner[2]), 0)) → zSequence(Segment[((0.75 * i), 0), ((0.75 * i), -0.025)], i, 1, 4) → list1Segment(P, (x(P), 0)) → bVector(B - (1.2, 0), B + (1.2, 0)) → vSequence(Segment[(0, (0.5 * i) - 1), (-0.025, (0.5 * i) - 1)], i, 0, 4) → list2Sequence(Segment[(x(B), (0.5 * i) - 1), (x(B) - 0.025, (0.5 * i) - 1)], i, 0, 4) → list3Segment(P, Q) → dSequence(Segment[B + ((0.5 * i) - 1, 0), B + ((0.5 * i) - 1, -0.025)], i, 0, 4) → list4Point(Ray[(0, 0), (-1, 0)]) → B_1Rotate(A_1, θ, B_1) → P_1Rotate(A_1, θ, B_1) → A'_2Rotate(A_1, θ, B_1) → A'_3Circle(B_1, A_1) → c_1Segment(B_1, P_1) → a_1
AI Drawing Prompt Reference
Draw a graph of a unit circle and a sine wave. A point P on the unit circle moves as the rotation angle θ changes, and its projection onto the x-axis forms the sine wave. The graph includes triangles, tangent lines, and bar charts to show relationships between angles, side lengths, and function values. The construction order starts with the unit circle, then rotates point P, draws projection points, and generates the sine wave sequence, adding auxiliary graphics for clarity.
The prompt above was compiled from the original drawing commands and is for reference only.