
Understanding Probability Rules
Loading the math board and drawing, please wait…
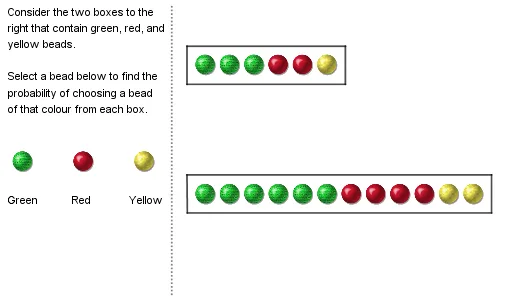
This example demonstrates the basic concepts and graphical representation of probability rules. It involves core mathematical concepts such as probability, symmetry, volume calculation, and Riemann sums. The construction uses commands and objects like Segment, Polygon, Circle, Text, and Vector in GeoGebra. Suitable for introductory psychology or statistics courses at the university level.
GeoGebra Commands & Parameters
Segment((3, 0), (19, 0)) → lightsep2Polygon(G, H, I, J) → q1, g, h, i, jPolygon(G_1, H_1, I_1, J_1) → q1_1, g_1, h_1, i_1, j_1Circle(PC1, 0.4) → circout1Circle(PC2, 0.4) → circout2Circle(PC3, 0.4) → circout3Text("startingcolor") → VarColorText("The chances of drawing a " + VarColor + " bead are...") → text2Vector(P1_1, P1_2) → uVector(P2_1, P2_2) → vVector(P3_1, P3_2) → wVector(P4_1, P4_2) → aVector(P5_1, P5_2) → bVector(P6_1, P6_2) → cVector(P7_1, P7_2) → dVector(P8_1, P8_2) → eVector(P9_1, P9_2) → fVector(P10_1, P10_2) → kVector(P11_1, P11_2) → lVector(P12_1, P12_2) → mVector(P1_3, P1_4) → nVector(P2_4, P2_3) → pVector(P3_4, P3_3) → qVector(P4_4, P4_3) → rVector(P5_4, P5_3) → sVector(P6_4, P6_3) → tSegment((8.5, 6.5), (8.5, -3)) → lightsep