
Understanding Euler's Identity
Loading the math board and drawing, please wait…
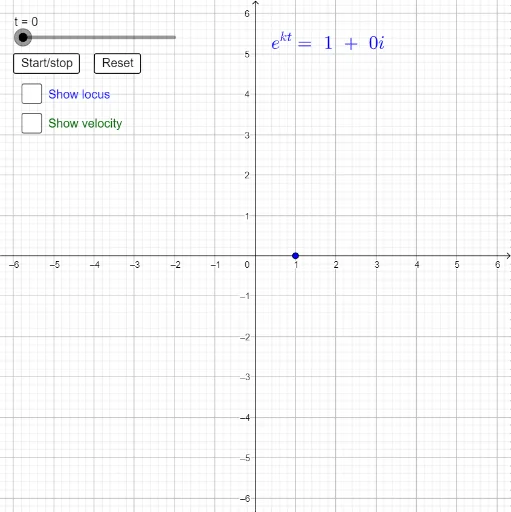
This example dynamically demonstrates the graph and properties of complex exponential functions, involving core concepts like complex numbers, exponential functions, Euler's identity, and trigonometric functions. It constructs the visualization using GeoGebra commands such as Intersect, Vector, Translate, and Locus. Suitable for high school and above mathematics learners to grasp the intuitive meaning of complex variable functions and Euler's identity.
GeoGebra Commands & Parameters
Intersect(xAxis, yAxis) → BVector(B, z_2) → uTranslate(z_1, u) → z_3Vector(z_1, z_3) → vLocus(z_1, t) → loc1
AI Drawing Prompt Reference
Draw a dynamic graph illustrating complex exponential functions, featuring the intersection point of the x-axis and y-axis, a vector from the intersection pointing to complex number z2, then translating based on complex number z1 to get point z3, another vector from z1 to z3, and finally showing the locus of z1 as parameter t varies, clearly demonstrating the relationship between complex numbers, exponential functions, and trigonometric functions.
The prompt above was compiled from the original drawing commands and is for reference only.