
Types of Modulus Functions
Loading the math board and drawing, please wait…
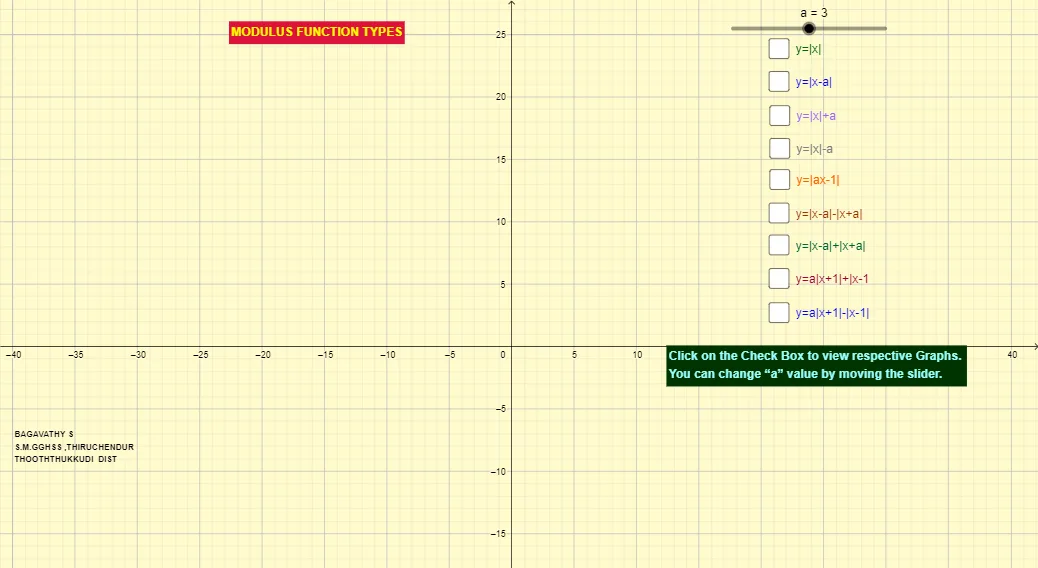
This GeoGebra example demonstrates various types of modulus functions (absolute value functions) and their graphical representations, providing an interactive way to explore function behaviors. Key mathematical concepts involved include absolute value functions, piecewise definitions, transformations of function graphs, and the impact of parameter variations. Based on the construction summary, the plot utilizes objects such as functions f and f_1, parameters like a, g, h, p, q, r, s, t (likely representing sliders or controls), and text elements text1, text2, text3 for annotations, showcasing GeoGebra commands for function plotting, dynamic parameter interaction, and geometric labeling. It is suitable for high school or college-preparatory mathematics courses, particularly in teaching function properties and graphing techniques.
GeoGebra Commands & Parameters
f: y = abs(x)Numeric a(3)g(x) = abs(x - a)h(x) = abs((a * x) - 1)p(x) = abs(x) + aq(x) = abs(x) - ar(x) = abs(x - a) - abs(x + a)s(x) = abs(x - a) + abs(x + a)t(x) = (a * abs(x + 1)) + abs(x - 1)f_1(x) = (a * abs(x + 1)) - abs(x - 1)Boolean b(false)Boolean c(false)Boolean d(false)Boolean e(false)Boolean i(false)Boolean j(false)Boolean k(false)Boolean l(false)Boolean m(false)
AI Drawing Prompt Reference
Draw a set of absolute value function graphs to illustrate various forms and transformations. Start with the basic V-shaped graph of the absolute value function with vertex at the origin. Then, using a variable parameter, plot several transformed curves: horizontal shift, vertical shift, absolute value of a product, difference and sum of two absolute values, and combined forms with parameters. Use distinct colors or line styles for each curve, and add text labels for their expressions. Include toggles to show or hide each curve for comparison, demonstrating how the parameter affects the shape.
The prompt above was compiled from the original drawing commands and is for reference only.