
Two Variable Division Power Graphing
Loading the math board and drawing, please wait…
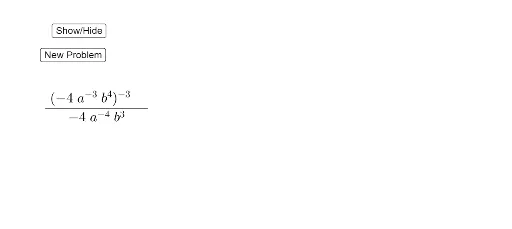
This example demonstrates the graph of two variable division power. Key mathematical concepts include power functions and the relationship between variables. Using GeoGebra commands such as Random and Simplify, the dynamic display of division power functions is shown. Suitable for high school mathematics education and learning.
GeoGebra Commands & Parameters
Random(0, 1) → C1Random(0, 1) → C2Random(0, 1) → C3Random(0, 1) → C4Random(0, 1) → C5Random(0, 1) → C6Random(0, 1) → C7Random(0, 1) → C8Random(0, 1) → C9Random(0, 1) → C10Random(0, 1) → C11Random(0, 1) → C12Random(0, 1) → C13Random(0, 1) → C14Random(0, 1) → C15Random($E$1, $F$1) → A1Random($E$1, $F$1) → A2Random($E$1, $F$1) → A3Random($E$1, $F$1) → A4Random($E$1, $F$1) → A5Random($E$1, $F$1) → A6Random($E$1, $F$1) → A7Random($E$1, $F$1) → A8Random($E$1, $F$1) → A9Random($E$1, $F$1) → A10Random($E$1, $F$1) → A11Random($E$1, $F$1) → A12Random($E$1, $F$1) → A13Random($E$1, $F$1) → A14Random($E$1, $F$1) → A15Simplify(b) → a
AI Drawing Prompt Reference
Plot a graph consisting of 15 randomly generated power functions in the form y = C1 * x^C2 / (C3 * x^C4 + C5 * x^C6 + C7 * x^C8 + C9 * x^C10 + C11 * x^C12 + C13 * x^C14 + C15 * x^C15), where C1 to C15 are random numbers between 0 and 1.
The prompt above was compiled from the original drawing commands and is for reference only.