
Two Classic Inequalities Demo
Loading the math board and drawing, please wait…
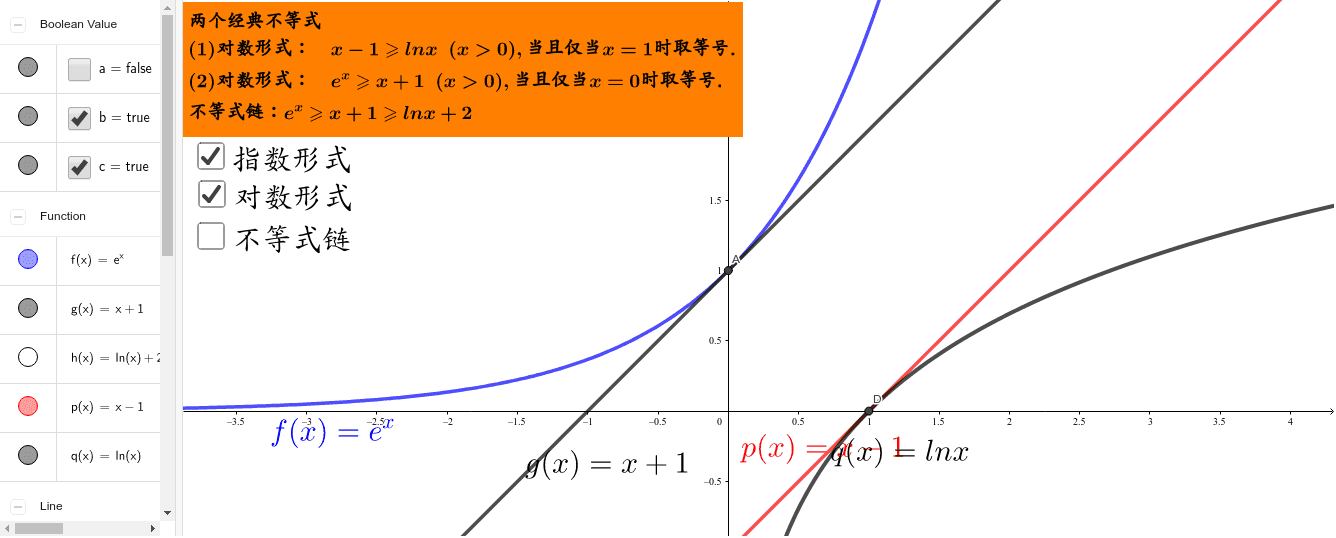
This example dynamically demonstrates two classic inequalities, visually illustrating their geometric manifestations. Core math concepts include derivatives, inequality proofs, hyperbola properties, incircle geometry, and statistical data analysis. GeoGebra commands like Intersect, OrthogonalLine, and Segment are used to construct function graphs and geometric element relationships. Suitable for high school and above mathematics teaching, deepening understanding of the integration of inequalities and geometry.
GeoGebra Commands & Parameters
Intersect(f, g, (2.5184646216909484E-8, 1.0000000251846466)) → AIntersect(g, h, (1.0000000298620209, 2.000000029862021)) → BOrthogonalLine(B, xAxis) → iIntersect(i, xAxis) → CSegment(B, C) → jIntersect(p, q, (1.0000001392637718, 1.3926377184780847E-7)) → D
AI Drawing Prompt Reference
In one coordinate plane, draw the geometric relations among several curves labeled p, q, f, g, and h. First mark the intersection point A of f and g at the given approximate location, then mark the intersection point B of g and h at its given approximate location. Through B, draw a line perpendicular to the x-axis, let it meet the x-axis at point C, and show the segment connecting B and C. Finally, mark the intersection point D of p and q at the provided approximate location.
The prompt above was compiled from the original drawing commands and is for reference only.