
Investigating Multiplicity of Zeros of Polynomial Functions
Loading the math board and drawing, please wait…
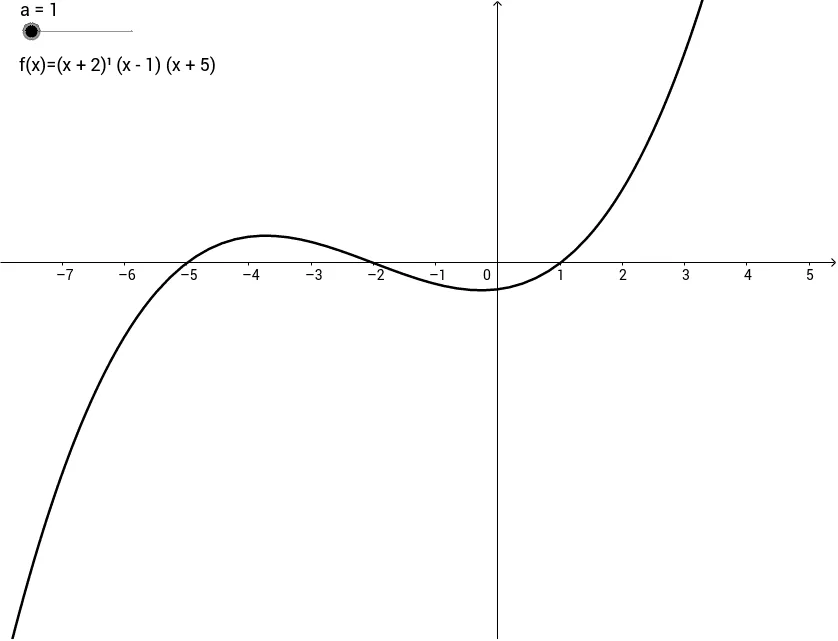
This interactive worksheet demonstrates the geometric meaning of the multiplicity of zeros for polynomial functions. It shows how different multiplicities (e.g., 1, 2, 3) affect the graph's behavior near the zero: crossing the x-axis, touching it tangentially, or creating an inflection-like flattening. The core mathematical concepts include polynomial factorization, zero multiplicity, local graph shape, and sign changes of the derivative. Construction details: The GeoGebra file uses objects such as polynomial function a, its graph f, and a text label text1, allowing users to manipulate parameters or observe preset examples to compare different multiplicity cases dynamically. This resource is suitable for high school or introductory college mathematics, particularly for teaching function analysis and derivatives, and can be used for classroom demonstrations or student self-exploration.
GeoGebra Commands & Parameters
Numeric a(1.0)f(x) = (x + 2)^(a) * (x - 1) * (x + 5)
AI Drawing Prompt Reference
Draw the graph of a polynomial function with a parameter a that controls the multiplicity at one root. Define f(x)=(x+2)^a·(x−1)·(x+5) and plot the resulting curve. Mark the key x-axis zeros at x=−2, x=1, and x=−5 and interpret how they shape the curve locally. Make a adjustable (e.g., a slider) so you can compare cases such as a=1, 2, or 3: near x=−2 the graph should transition between crossing, touching/tangency, and flattening-like behavior, while the other zeros remain simple.
The prompt above was compiled from the original drawing commands and is for reference only.