
Trigonometric Graph Plotting (Angles > 90°)
Loading the math board and drawing, please wait…
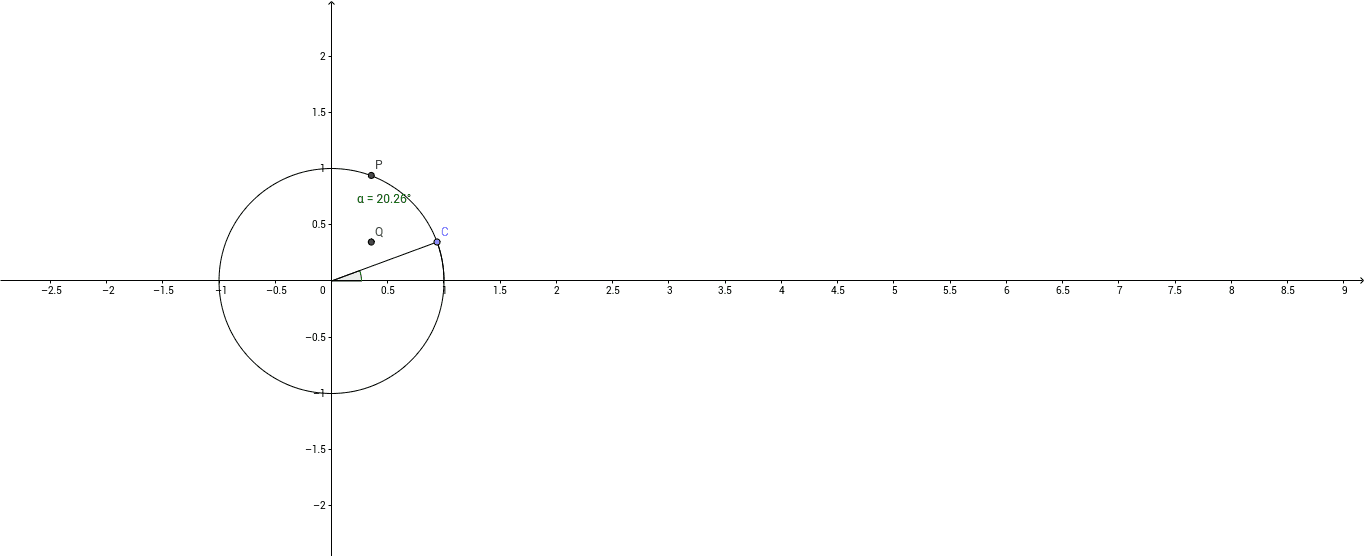
This example demonstrates how trigonometric graphs are plotted when the angle exceeds 90 degrees. The core math concepts involved include trigonometric functions, periodicity, and graph transformations. The construction utilizes GeoGebra commands and objects such as Intersect, Circle, Point, Segment, Angle, OrthogonalLine, and CircleArc as outlined in the summary. It is suitable for high school students learning about trigonometric functions, providing an intuitive understanding of the function's behavior with extended angles.
GeoGebra Commands & Parameters
Intersect(xAxis, yAxis) → ACircle(A, B) → cPoint(c) → CIntersect(xAxis, yAxis) → DSegment(D, C) → aAngle(B, A, C) → αOrthogonalLine(C, xAxis) → bIntersect(b, xAxis) → EOrthogonalLine(C, yAxis) → dIntersect(d, yAxis) → FCircleArc(A, B, C) → e
AI Drawing Prompt Reference
Draw a coordinate system with x and y axes. Create a circle centered at the point on the x-axis, and draw an arc with the intersection of the circle and the x-axis as a vertex. Draw a line perpendicular to the x-axis from the intersection of the circle and the y-axis, and another line perpendicular to the y-axis from the intersection of this line and the x-axis. Connect the point on the x-axis to the intersection of the circle and the y-axis, and display all points and lines.
The prompt above was compiled from the original drawing commands and is for reference only.