
Trigonometric Function Addition Demo
Loading the math board and drawing, please wait…
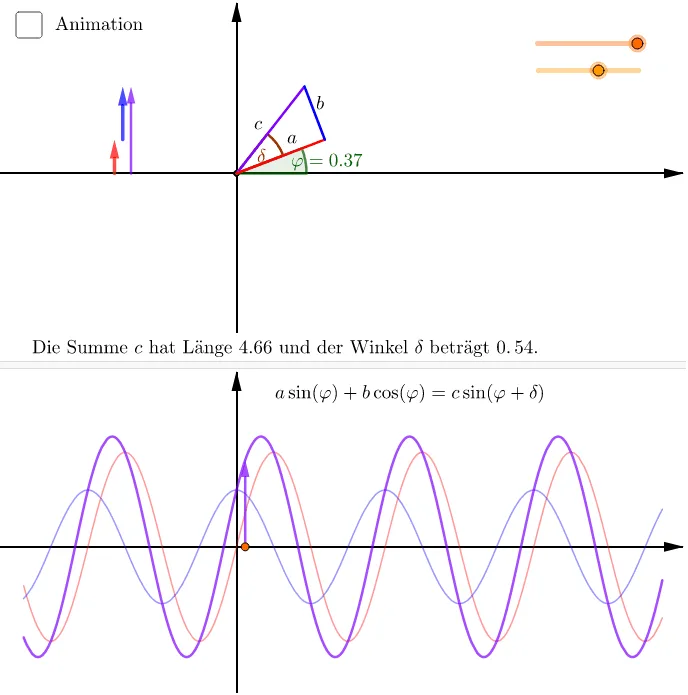
This example demonstrates the addition formulas of trigonometric functions and their graphical representations. It involves core math concepts like trigonometric functions, vectors, coordinate geometry, function graphing, and transformations. Construction highlights include commands like Point, Segment, Vector, Angle, and objects such as a, phi, avec, based on the GeoGebra summary. Suitable for high school and above students to understand properties and graphical transformations of trigonometric functions.
GeoGebra Commands & Parameters
Point(Segment[(-7, 0), (18, 0)]) → DSegment((0, 0), avec + bvec) → CSegment((0, 0), avec) → AVector((shift - 0.2, 0), (shift - 0.2, y(avec))) → aprojSegment(avec, avec + bvec) → BAngle(xAxis, A) → φVector((0.15 + shift, y(aproj)), (0.15 + shift, y(aproj) + y(bvec))) → bprojAngle(A, C) → δVector((0.5 + shift, 0), (0.5 + shift, y(cvec))) → cprojVector(D, (phi, h(phi))) → i
AI Drawing Prompt Reference
Draw a horizontal line segment in a coordinate system and mark two points on it to form a new line segment. From the origin, draw two parallel line segments to the new line and the horizontal line, marking the angles they make with the horizontal line. Then, draw projection line segments from these two line segments and mark the angle between them. Finally, draw a vector from one endpoint of the horizontal line segment pointing to a specific angle and height to demonstrate the addition formulas of trigonometric functions and their graphical representations.
The prompt above was compiled from the original drawing commands and is for reference only.