
Triangle Inequality Investigation
Loading the math board and drawing, please wait…
In collections
Geo&Alg:Area Volume Pythagorean Th.
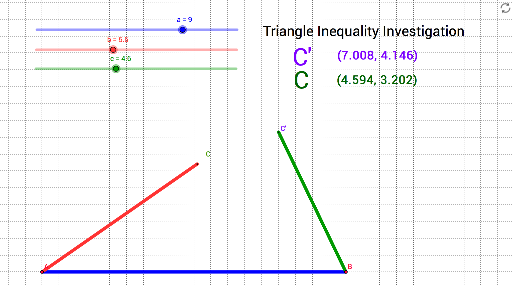
This GeoGebra example investigates the triangle inequality theorem by allowing users to manipulate points A, B, and C to change side lengths a, b, and c. The construction visually confirms that a + b > c, b + c > a, and c + a > b hold for any triangle. Core concepts include the triangle inequality, segment construction, and coordinate geometry. The model uses GeoGebra commands such as Segment, Point, and Text to create objects a, b, c, A, B, C, and explanatory texts. It is suitable for high‑school geometry classes and Olympiad preparation.
GeoGebra Commands & Parameters
Segment(A, B) → dPoint(Circle[A, b]) → CSegment(A, C) → ePoint(Circle[B, c]) → C'Segment(B, C') → fText(C) → text2Text(C') → text3
AI Drawing Prompt Reference
Draw a triangle inequality investigation diagram. Start with two fixed points as two vertices of a triangle, and connect them to form one side. Then, using one vertex as the center, draw a circle with a radius equal to a side length, and pick a point on the circle as the third vertex, connecting it to the center to form the second side. Next, using the other vertex as the center, draw another circle with a different side length as radius, pick another point on this circle, and connect it to the center to form the third side. Finally, add text labels near the two newly picked points to indicate that the sum of any two side lengths is greater than the third side.
The prompt above was compiled from the original drawing commands and is for reference only.