
Tree Diagrams with the Multiplication Principle
Loading the math board and drawing, please wait…
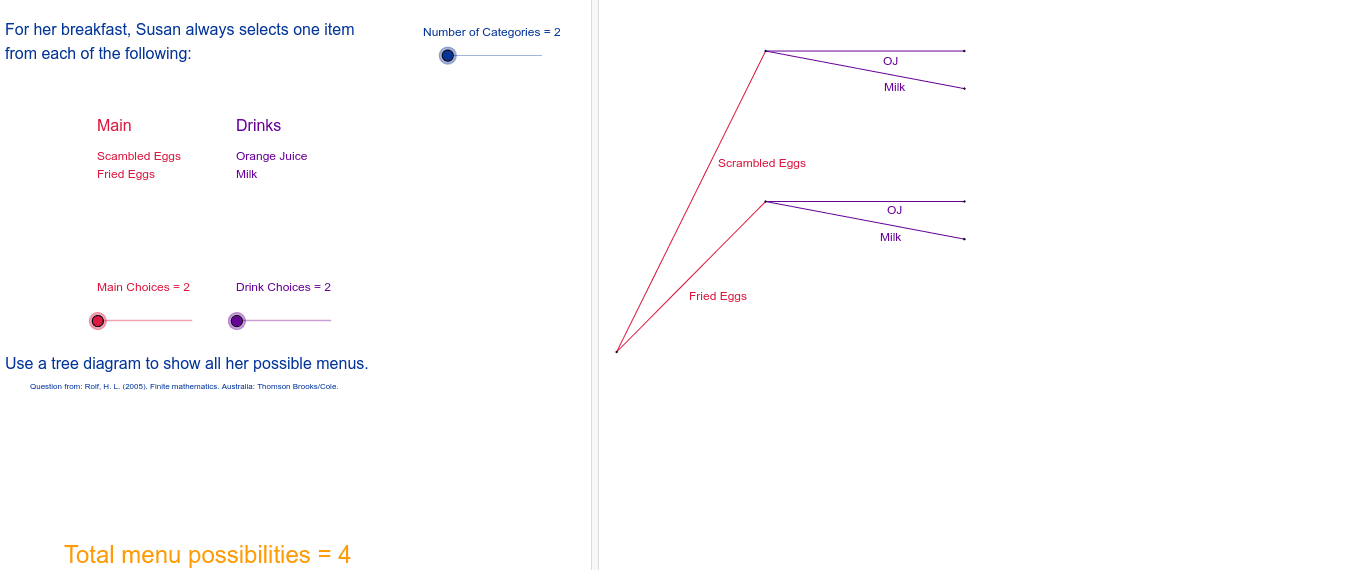
① This interactive worksheet demonstrates how tree diagrams visually represent the Multiplication Principle in counting combinations, allowing users to explore different choice sets. ② The core mathematical concept is the Multiplication Principle (fundamental counting principle): if a task consists of sequential steps with a fixed number of choices each, the total number of outcomes is the product of the choices. ③ Construction details: The diagram is built using GeoGebra commands Point, Segment, and If, with objects such as choices, drinks, sides, main, text1-text6, and point arrays A1-A5, B1-B5, C1-C5 to position branch nodes, plus D1 and E1-E14 to complete the tree structure. Text labels annotate each branch and the final counts. ④ Suitable for middle and high school mathematics (probability and combinatorics), useful for classroom demonstrations or student self-exploration to connect tree diagrams with the multiplication principle.
GeoGebra Commands & Parameters
Point(yAxis) → M_3Segment(M_3, L_3) → aSegment(M_3, K_3) → bSegment(M_3, J_3) → cSegment(M_3, I_3) → dSegment(L_3, H_3) → eSegment(L_3, G_3) → fSegment(L_3, F_3) → gSegment(L_3, E_3) → hSegment(K_3, D_3) → iSegment(K_3, C_3) → jSegment(K_3, B_3) → kSegment(K_3, A_3) → lSegment(J_3, Z_2) → mSegment(J_3, W_2) → nSegment(J_3, V_2) → pSegment(J_3, U_2) → qSegment(I_3, T_2) → rSegment(I_3, S_2) → sSegment(I_3, R_2) → tSegment(I_3, Q_2) → a_1Segment(H_3, A) → b_1Segment(H_3, B) → c_1Segment(H_3, C) → d_1Segment(H_3, D) → e_1Segment(G_3, E) → f_1Segment(G_3, F) → g_1Segment(G_3, G) → h_1Segment(G_3, H) → i_1Segment(F_3, I) → j_1Segment(F_3, J) → k_1Segment(F_3, K) → l_1Segment(F_3, L) → m_1Segment(E_3, M) → n_1Segment(E_3, N) → p_1Segment(E_3, O) → q_1Segment(E_3, P) → r_1Segment(D_3, Q) → s_1Segment(D_3, R) → t_1Segment(D_3, S) → a_2Segment(D_3, T) → b_2Segment(C_3, U) → c_2Segment(C_3, V) → d_2Segment(C_3, W) → e_2Segment(C_3, Z) → f_2Segment(B_3, A_1) → g_2Segment(B_3, B_1) → h_2Segment(B_3, C_1) → i_2Segment(B_3, D_1) → j_2Segment(A_3, E_1) → k_2Segment(A_3, F_1) → l_2Segment(A_3, G_1) → m_2Segment(A_3, H_1) → n_2Segment(Z_2, I_1) → p_2Segment(Z_2, J_1) → q_2Segment(Z_2, K_1) → r_2Segment(Z_2, L_1) → s_2Segment(W_2, M_1) → t_2Segment(W_2, N_1) → a_3Segment(W_2, O_1) → b_3Segment(W_2, P_1) → c_3Segment(V_2, Q_1) → d_3Segment(V_2, R_1) → e_3Segment(V_2, S_1) → f_3Segment(V_2, T_1) → g_3Segment(U_2, U_1) → h_3Segment(U_2, V_1) → i_3Segment(U_2, W_1) → j_3Segment(U_2, Z_1) → k_3Segment(T_2, A_2) → l_3Segment(T_2, B_2) → m_3Segment(T_2, C_2) → n_3Segment(T_2, D_2) → p_3Segment(S_2, E_2) → q_3Segment(S_2, F_2) → r_3Segment(S_2, G_2) → s_3Segment(S_2, H_2) → t_3Segment(R_2, I_2) → a_4Segment(R_2, J_2) → b_4Segment(R_2, K_2) → c_4Segment(R_2, L_2) → d_4Segment(Q_2, M_2) → e_4Segment(Q_2, N_2) → f_4Segment(Q_2, O_2) → g_4Segment(Q_2, P_2) → h_4If(choices ≟ 3, main * drinks * sides, main * drinks) → total
AI Drawing Prompt Reference
Draw a tree diagram illustrating the multiplication principle. Start from a single top node, branching into four main branches, each of which further splits into four sub-branches, resulting in sixteen terminal nodes. Use straight line segments for branches and dots for nodes. Add text labels beside each main and sub-branch to indicate the categories of choices at each level (e.g., drinks, main courses, sides), and label each terminal node with the total number of combinations. Arrange the tree symmetrically from top to bottom, with uniform branch lengths and consistent spacing between nodes to create a clear hierarchical structure.
The prompt above was compiled from the original drawing commands and is for reference only.