
Probability Tree & Venn Diagrams Interactive Demo by sakhanh
Loading the math board and drawing, please wait…
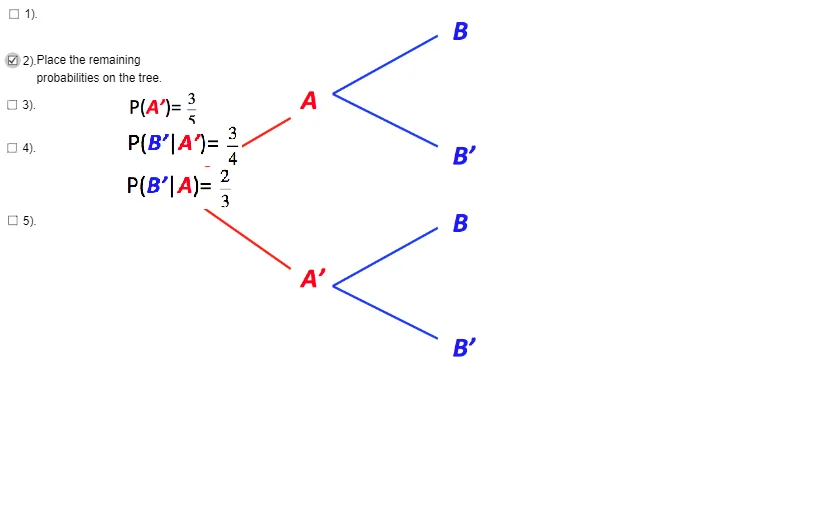
① This GeoGebra example dynamically illustrates the construction and interconnection of probability tree diagrams and Venn diagrams, enabling learners to intuitively grasp random events and their probability relationships. ② Core mathematical concepts include probability calculation, conditional probability, event intersection and union, expected value, arithmetic mean, and probability distributions over real numbers. ③ Construction highlights: from the summary, numerous image objects (pic1 to pic16) serve as graphical elements, text objects (text1 to text5) label probability values, and variables a, b, c, d, e control parameters for different branches or regions, allowing dynamic adjustment via sliders or input fields. ④ Suitable for middle school (introductory probability) through high school probability and statistics, as well as basic university probability courses; ideal for classroom demonstrations or student self-exploration of the relationship between tree diagrams and Venn diagrams.
GeoGebra Commands & Parameters
Boolean a(false)Boolean b(true)Boolean c(false)Boolean d(false)Boolean e(false)
AI Drawing Prompt Reference
Create an interactive demo of probability tree diagrams and Venn diagrams. Start by drawing a probability tree with 16 nodes and multiple branches, controlled by 5 boolean variables. Then, draw a Venn diagram to show the intersection and union of events. Add 5 labels to display probability values and use sliders to dynamically adjust parameters, linking the tree diagram and Venn diagram.
The prompt above was compiled from the original drawing commands and is for reference only.