
Creating Double Number Line Diagrams Example
Loading the math board and drawing, please wait…
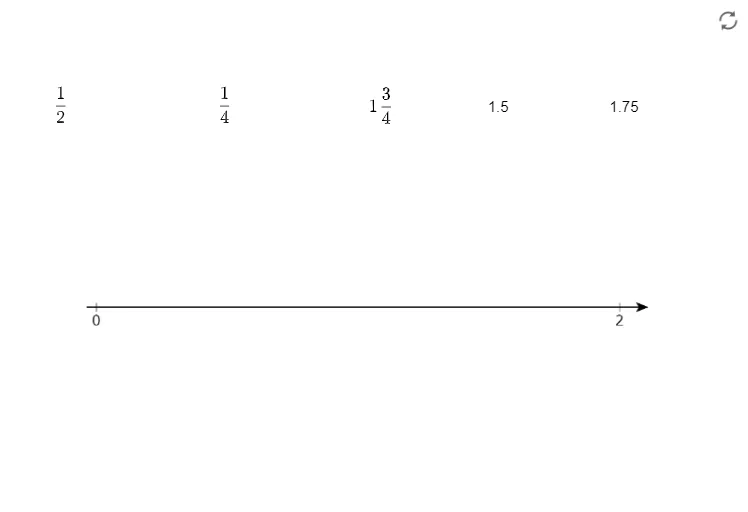
This example demonstrates how to use GeoGebra to create double number line diagrams for comparing relationships between different quantities. Core math concepts include ratios, unit rates, and data visualization. Construction highlights involve using GeoGebra objects A, B, pic1, text1, text2, text3, text4, text5 to build axes, labels, and images. Suitable for upper elementary and middle school students to understand ratios and data representation.
GeoGebra Commands & Parameters
Point A(0, 0)Point B(13, 0)
AI Drawing Prompt Reference
Create a double number line diagram with two parallel horizontal axes, one above the other. Start with a point at the left end of each axis, then extend both lines to the right with evenly spaced tick marks. Align the tick marks vertically so that corresponding values on the two axes line up, showing the relationship between two quantities. Add text labels near each axis to indicate what each line represents, and include a small illustrative image nearby. The diagram should clearly display ratios and unit rates for easy comparison.
The prompt above was compiled from the original drawing commands and is for reference only.