
Trapezoid C: Trapezoidal Sum Demonstration
Loading the math board and drawing, please wait…
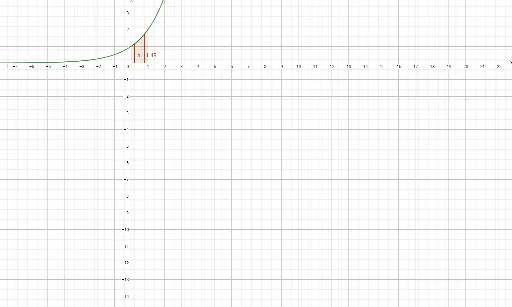
This GeoGebra example demonstrates the trapezoidal rule for numerical integration by using the TrapezoidalSum command to approximate the area under a function curve. The core mathematical concept is the approximation of definite integrals through summing areas of trapezoids, a fundamental technique in calculus. The construction involves defining a function f and an interval endpoint a, then applying the TrapezoidalSum command to generate trapezoidal subdivisions and display their individual and total areas. This visualization is ideal for high school or early college students learning calculus, helping them grasp the geometric meaning of Riemann sums and the trapezoidal rule. It also allows exploration of how increasing the number of trapezoids improves approximation accuracy, making it a valuable tool for teaching numerical methods and integral approximation.
GeoGebra Commands & Parameters
TrapezoidalSum(2^(x), 0, 1, 5) → a
AI Drawing Prompt Reference
Draw a coordinate plane with an exponential curve extending from x=0 to x=1. Below the curve, divide the interval into five equal-width vertical strips, and connect the top points of each strip with straight line segments to form five adjacent trapezoids. These trapezoids tightly cover the area between the curve and the x-axis. Fill each trapezoid with a light color and label its area value, while also displaying the total area of the whole region as a number near the graph. Include tick marks on both axes, draw the curve as a smooth solid line, and use dashed or thin solid lines for trapezoid boundaries to clearly illustrate the trapezoidal approximation of the integral.
The prompt above was compiled from the original drawing commands and is for reference only.