
Trapezium Rule Demonstration
Loading the math board and drawing, please wait…
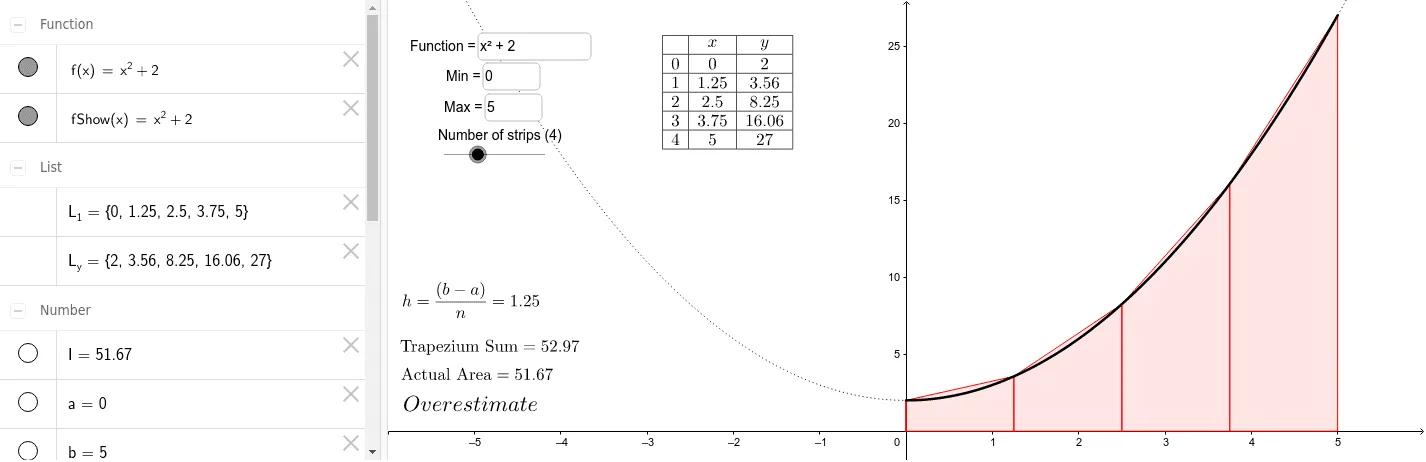
This example demonstrates the Trapezium Rule for numerical integration, approximating definite integrals by dynamically adjusting intervals and subdivisions; core math concepts include definite integrals, trapezoidal summation, and function graphing; constructed using GeoGebra commands like Integral, Textfield, Sequence, TrapezoidalSum, Function, TableText, If, suitable for high school students and calculus beginners learning numerical integration methods.
GeoGebra Commands & Parameters
Integral(f, a, b) → ITextfield(f) → inputBox1Textfield(a) → inputBox2Textfield(b) → inputBox3Sequence(a + ((b - a) * i / n), i, 0, n) → L_1TrapezoidalSum(f, a, b, n) → cFunction(f, a, b) → fShowTableText({Append["", Sequence[i, i, 0, n]], Append[x, L_1], Append[y, L_y]}, "vc|_") → text4If(I < c, LaTeX["Overestimate"], LaTeX["Underestimate"]) → text4_1
AI Drawing Prompt Reference
Demonstrate the Trapezium Rule for numerical integration with a function graph and dynamically adjustable subintervals, showing overestimate or underestimate by comparing trapezoidal sum with integral value, and allow dynamic adjustment of intervals and subdivisions, with text annotations for the function, intervals, and results.
The prompt above was compiled from the original drawing commands and is for reference only.