
Translation Demo
Loading the math board and drawing, please wait…
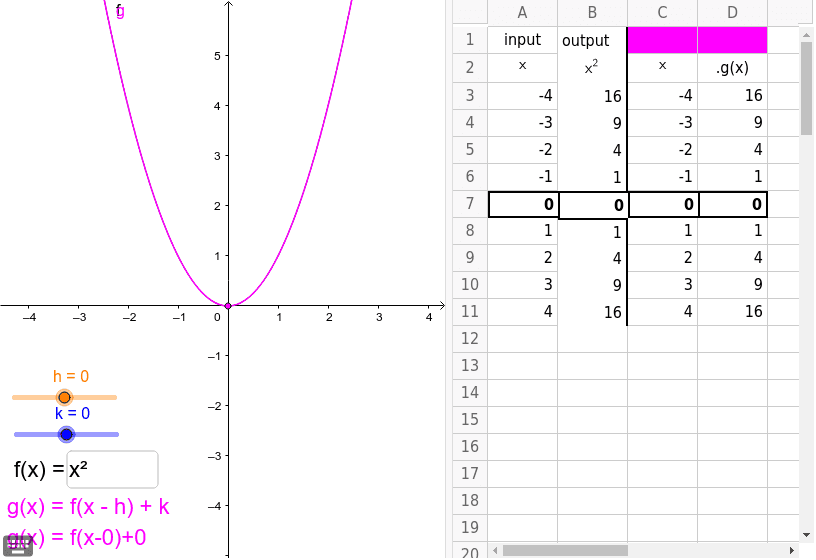
This example demonstrates the transformation of the function g(x)=f(x-h)+k, visually showing how the graph shifts along the x-axis and y-axis. Core math concepts include function transformation, translation, and geometric construction. It uses GeoGebra commands like OrthogonalLine, Intersect, Segment, and Textfield, along with objects such as k, h, A, etc. Suitable for high school and university-level mathematics education to understand the properties of function transformations.
GeoGebra Commands & Parameters
OrthogonalLine(A, yAxis) → bIntersect(b, yAxis) → CSegment(A, C) → eOrthogonalLine(A, xAxis) → aIntersect(a, xAxis) → BSegment(B, O) → cSegment(O, C) → dSegment(A, B) → iTextfield(f) → inputBox1
AI Drawing Prompt Reference
Draw a function graph to demonstrate the transformation g(x)=f(x-h)+k, visually showing how the graph shifts along the x-axis and y-axis. Start by plotting the origin O and coordinate axes, then determine point A based on input h and k. Draw perpendicular lines from A to the x-axis and y-axis, intersecting them at points B and C respectively. Connect A to C and B to O to form line segments e, c, d, and i. Finally, display the value of function f in a text box.
The prompt above was compiled from the original drawing commands and is for reference only.