
Function Translation Demonstration by Peter DeCraene
Loading the math board and drawing, please wait…
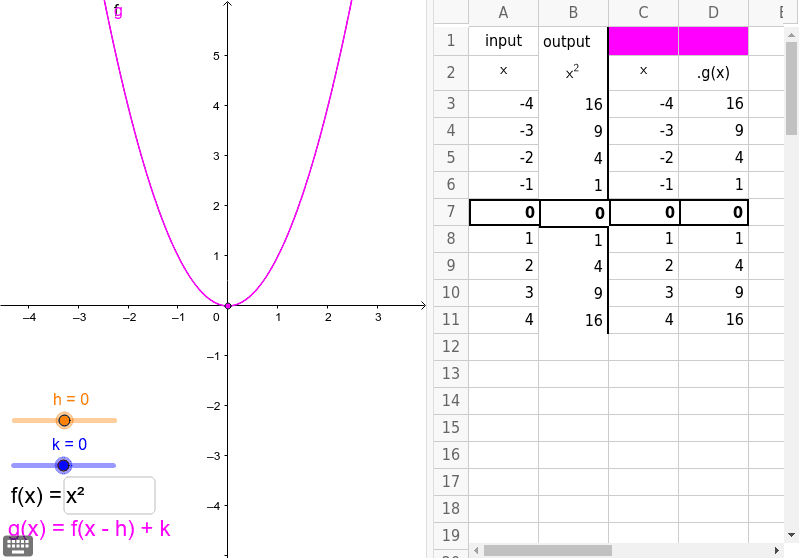
This applet demonstrates how transformations of the form f(x-h)+k affect the graph and table of values. Key mathematical concepts include function transformations. Construction highlights the use of GeoGebra commands such as OrthogonalLine, Intersect, Segment, and Textfield.
GeoGebra Commands & Parameters
OrthogonalLine(A, yAxis) → bIntersect(b, yAxis) → CSegment(A, C) → eOrthogonalLine(A, xAxis) → aIntersect(a, xAxis) → BSegment(B, O) → cSegment(O, C) → dSegment(A, B) → iTextfield(f) → inputBox1
AI Drawing Prompt Reference
Draw a function graph and demonstrate how translation transformations affect it. Start by plotting the coordinate axes, then mark the origin. Draw a line segment from the origin along the positive x-axis and another along the positive y-axis. Find the intersection of a vertical line parallel to the x-axis with the y-axis. Connect the origin to this intersection point and draw a line parallel to the vertical line from the origin. Finally, add a text box next to the graph for entering the function expression.
The prompt above was compiled from the original drawing commands and is for reference only.