
Translation and Scatter Plot Analysis
Loading the math board and drawing, please wait…
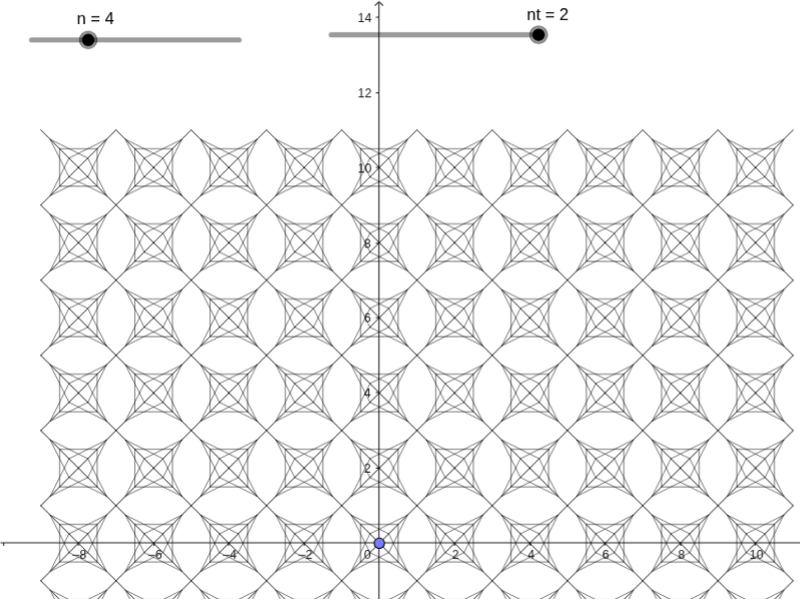
This example demonstrates translation transformations of points and segments, and their representation in scatter plots; involves core math concepts like translation, integer operations, scatter plot construction, hypothesis testing, difference and slope calculation; constructed using GeoGebra commands such as PointIn, Segment, Sequence, Mirror; suitable for high school mathematics teaching, illustrating the integration of geometric transformations and data analysis.
GeoGebra Commands & Parameters
PointIn(Polygon[{B, C, D, E}]) → ASegment(A, B) → fSegment(A, C) → gSequence(Segment[Point[f, i], Point[g, 1 - i]], i, 0, 1, 1 / n) → S_1Segment(A, D) → hSequence(Segment[Point[g, i], Point[h, 1 - i]], i, 0, 1, 1 / n) → S_2Segment(A, E) → lSequence(Segment[Point[l, i], Point[f, 1 - i]], i, 0, 1, 1 / n) → S_4Sequence(Segment[Point[h, i], Point[l, 1 - i]], i, 0, 1, 1 / n) → S_3Mirror(L_1, Line[E, B]) → L_2Mirror({L_1, L_2}, Line[B, C]) → L_3Sequence(Translate[L_4, Vector[((2 * i) * Vector[D, E])]], i, (-nt), nt) → L_5Sequence(Translate[L_5, Vector[((2 * i) * Vector[E, B])]], i, (-nt), nt) → L_6