
Translation along the x-axis
Loading the math board and drawing, please wait…
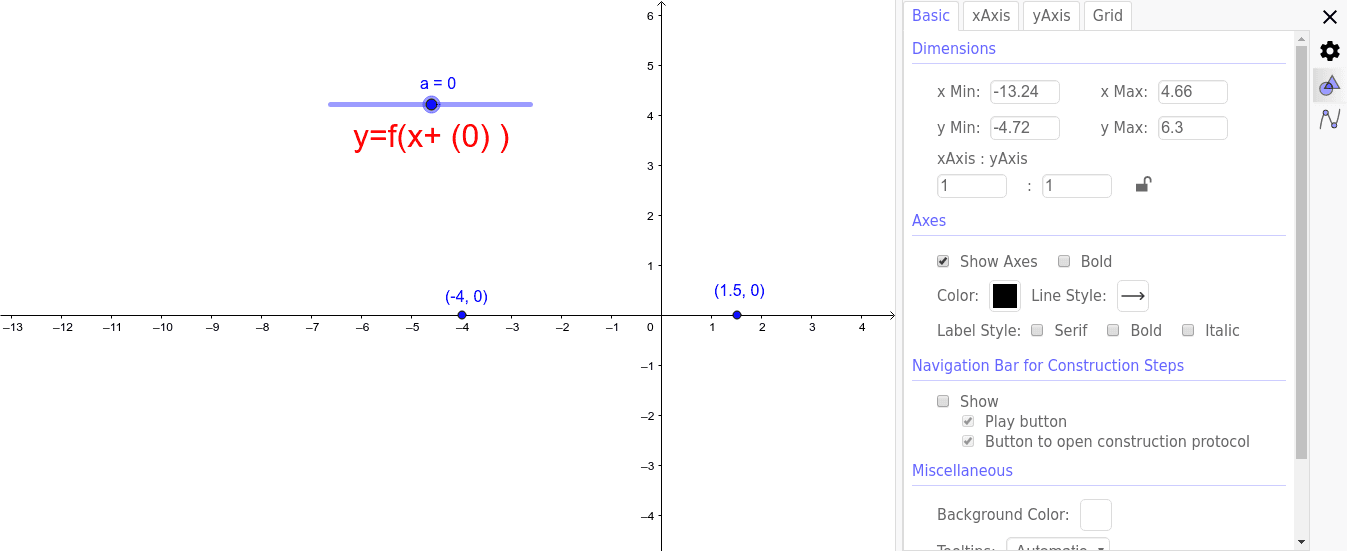
This GeoGebra example demonstrates the geometric transformation of a function graph translated along the x-axis, allowing users to visually explore how horizontal shifts alter the position of the curve. The core mathematical concept is translation in the Cartesian coordinate system, focusing on the relationship between the original function and its shifted version, including changes in the algebraic expression. The construction uses the Max command and involves objects such as a, f, A, B, C, and a text label (text1), where f likely represents the function being translated, A, B, C serve as auxiliary or control points, and text1 displays relevant coordinates or shift information. This resource is suitable for middle or high school students learning function transformations, coordinate geometry, or graphing, and is also useful for teachers demonstrating the visual and algebraic effects of horizontal translation in a dynamic environment.
GeoGebra Commands & Parameters
Max(f, -3 - a, -1 - a) → B
AI Drawing Prompt Reference
Draw a function graph f and translate it horizontally by a units to the right, where a is a value controlled by a slider. First, draw the function f, then create a slider a with a range from -3 to -1. Use the Max command to find the maximum value between f and the two shifted points, resulting in the translated graph B.
The prompt above was compiled from the original drawing commands and is for reference only.