
Transforming the Basic Sine Curve: Effects of Parameters A, B, C, D
Loading the math board and drawing, please wait…
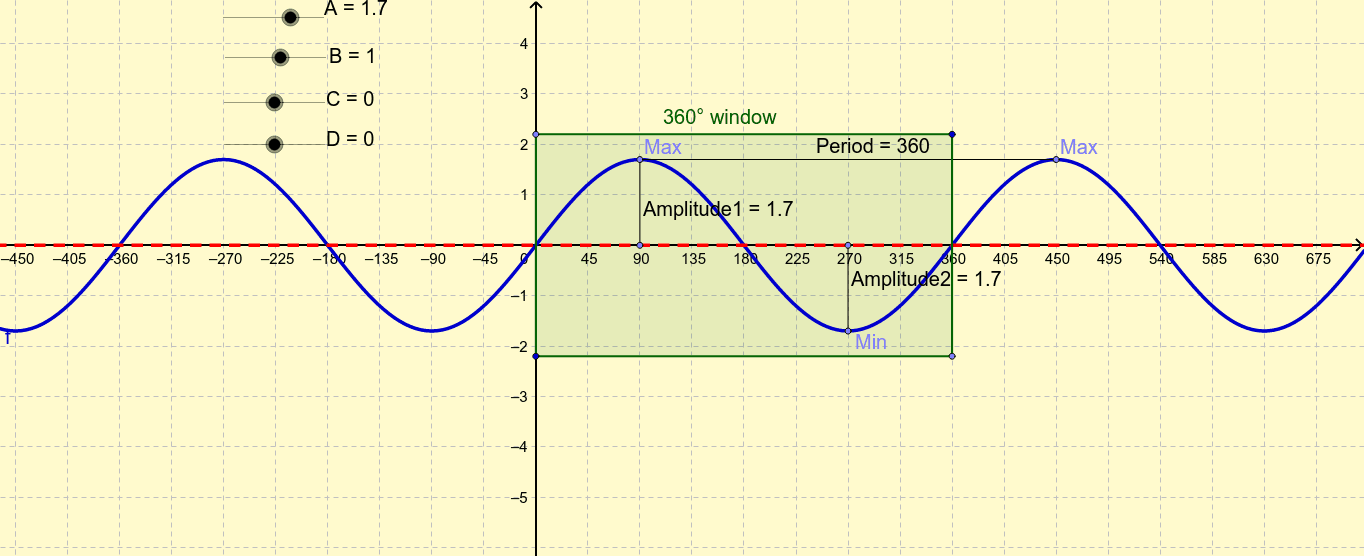
This interactive GeoGebra activity illustrates the fundamental features of a sine curve and demonstrates how the parameters A, B, C, and D in the equation y = A sin(B(x - C)) + D affect its graph. It visually shows amplitude, period, horizontal phase shift, and vertical translation. The construction uses GeoGebra commands such as Segment and Polygon, along with objects including A, B, C, D, a, F, E, f, G, H, I, Amplitude1, Period, J, K, L, Amplitude2, M, N, O, P, poly1, m, o, p, and n. These elements help build auxiliary shapes and dynamic sliders for parameter adjustment. This resource is suitable for high school or introductory college mathematics, ideal for classroom demonstrations or self-study to grasp the geometric meaning of each parameter in trigonometric function transformations.
GeoGebra Commands & Parameters
Segment(E, I) → Amplitude1Segment(E, H) → PeriodSegment(K, L) → Amplitude2Polygon(M, O, P, N) → poly1, m, o, p, n
AI Drawing Prompt Reference
Draw a basic sine curve and modify its amplitude, period, horizontal shift, and vertical translation by adjusting parameters A, B, C, and D. First, draw two amplitude line segments, then a period line segment. Next, draw a quadrilateral as an auxiliary shape. Finally, use dynamic sliders to adjust these parameters and observe the changes in the graph.
The prompt above was compiled from the original drawing commands and is for reference only.