
Transforming Linear Functions by Valerie Higgins
Loading the math board and drawing, please wait…
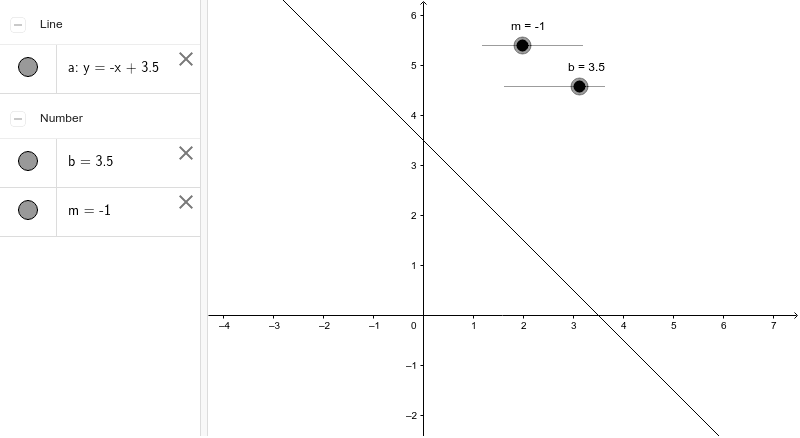
This example demonstrates how changing the slope and y-intercept affects the graph of a linear function. Key math concepts include the properties of linear functions and the impact of parameters on function graphs. Construction highlights: utilizes GeoGebra commands/objects like m (slope), b (y-intercept), and a (possibly for further transformations). Suitable for middle school and above students to learn about function graph transformations.
GeoGebra Commands & Parameters
Numeric m(-1.0)Numeric b(3.5)y = m * x + b
AI Drawing Prompt Reference
Draw the graph of a linear function, showing how changing the slope and y-intercept alters the graph. Use sliders to control the values of the slope and y-intercept, and display the corresponding linear function graph.
The prompt above was compiled from the original drawing commands and is for reference only.