
Transformations of Exponential and Logarithmic Functions by Jeremiah Simmons
Loading the math board and drawing, please wait…
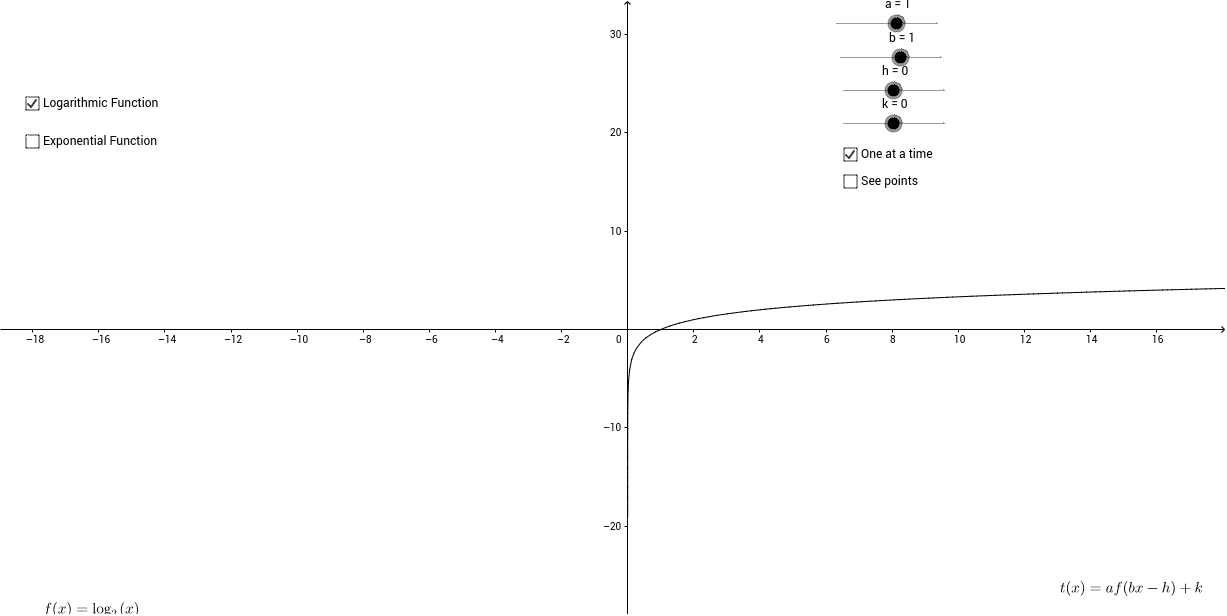
This example demonstrates the transformations of exponential and logarithmic function graphs, including translations and scalings. Key math concepts involve properties of exponential and logarithmic functions, rules of function graph transformations. Construction highlights the use of GeoGebra commands like Segment, Slider, and coordinate points (x_e, x_d, x_c, x_b, x_a, y_a, y_b, y_c, y_e, y_d), allowing dynamic adjustments of parameters a, b, h, k to observe graph changes. Suitable for high school mathematics education to understand the impact of transformations on function graphs.
GeoGebra Commands & Parameters
Segment(E', E) → Seg_ESegment(D', D) → Seg_DSegment(A', A) → Seg_ASegment(B', B) → Seg_BSegment(C', C) → Seg_C
AI Drawing Prompt Reference
Draw the transformation graph of exponential and logarithmic functions, including translations and scalings. Use sliders to adjust parameters a, b, h, k and observe changes in the function graph. First, draw points E' and E, then draw line segment Seg_E between E and E'. Next, draw points D' and D, and draw line segment Seg_D between D and D'. Then, draw points A' and A, and draw line segment Seg_A between A and A'. Finally, draw points B' and B, and draw line segment Seg_B between B and B'.
The prompt above was compiled from the original drawing commands and is for reference only.