
Transformation of Quadratic Function y=ax^2+k Graph
Loading the math board and drawing, please wait…
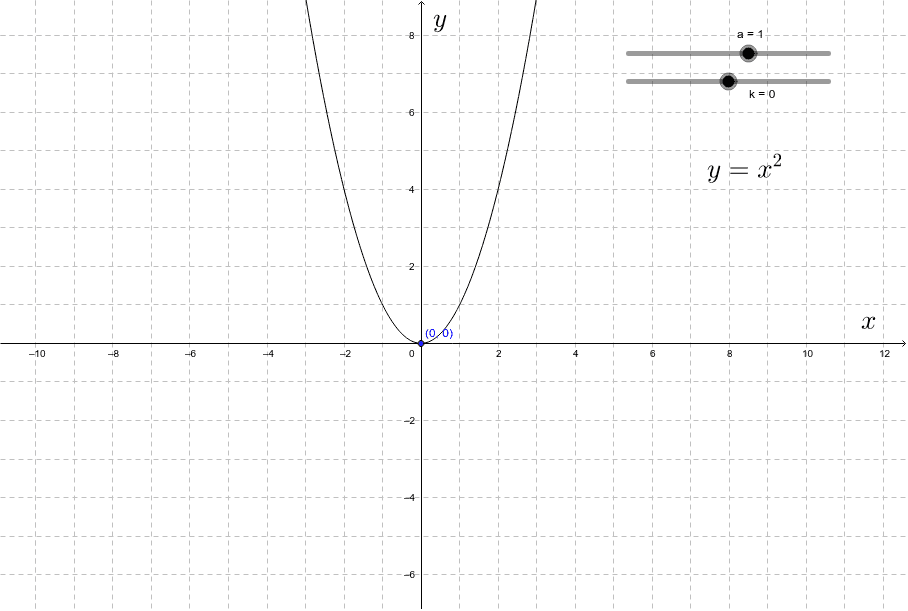
This example demonstrates observing the morphological changes of the quadratic function y=ax^2+k graph by varying the parameters a and k. The core mathematical concepts involved include quadratic function graphs, the effect of parameters on function graphs, vertex position, and opening direction. The construction uses GeoGebra commands/objects such as a, k, c, text1, text3, A, text1_1, where a and k serve as sliders to control parameter variations, text1 and text3 display parameter values, and A represents the vertex of the graph. It is suitable for high school mathematics teaching to understand the properties of quadratic function graphs and the meaning of parameters.
GeoGebra Commands & Parameters
Numeric a(1.0)Numeric k(0.0)y = (a * x^(2)) + k(0, k)
AI Drawing Prompt Reference
Draw the graph of a quadratic function y=ax^2+k with adjustable parameters a and k. Show the values of a and k, and mark the vertex of the function. Observe the morphological changes of the graph, including the direction of opening and the position of the vertex, as a and k vary.
The prompt above was compiled from the original drawing commands and is for reference only.