
Trajectory of Sum of Rotating Vectors
Loading the math board and drawing, please wait…
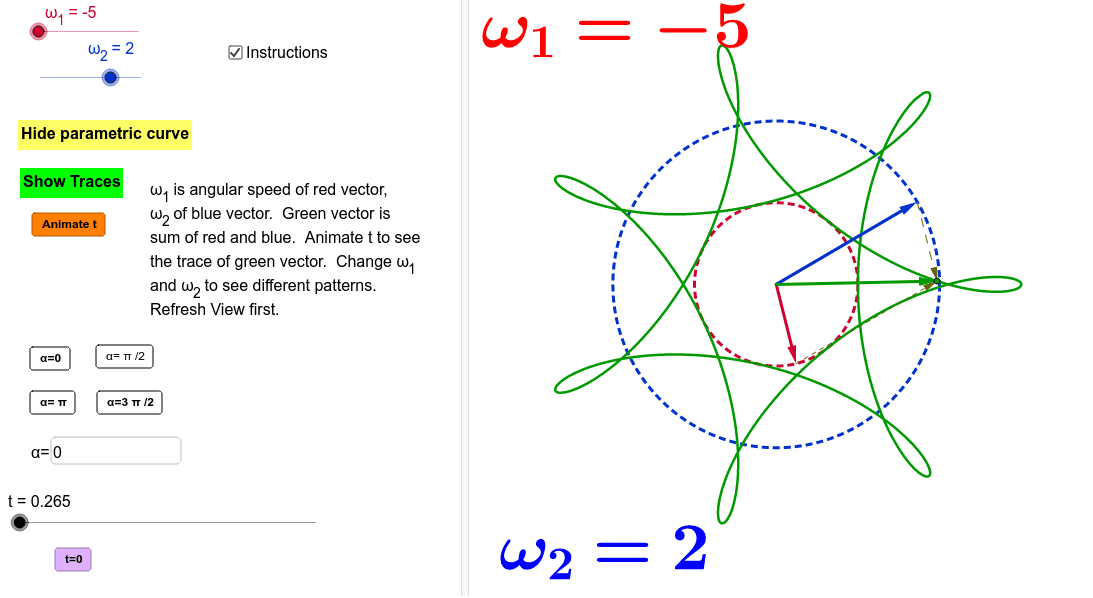
① This example demonstrates the path traced by the endpoint of the sum of two vectors with different magnitudes rotating at adjustable speeds, producing a variety of closed or open curves. ② Core mathematical concepts include vector addition, circular motion, parametric equations, locus, and elements of differential equations; by adjusting angular velocities, users can observe Lissajous-like patterns for different frequency ratios. ③ Construction highlights: using GeoGebra commands such as Circle, Vector, Translate, Intersect, CurveCartesian, Slider, Textfield, If, and Checkbox to build the rotating vectors, control speeds, and toggle trace display. ④ Suitable for high school to undergraduate students studying vectors, parametric curves, and dynamic geometry, as well as for physics demonstrations of superposition of harmonic motions or wave interference.
GeoGebra Commands & Parameters
Intersect(xAxis, yAxis) → ACircle(A, 2) → cCircle(A, 4) → dVector(A, X) → uVector(A, Y) → vTranslate(v, X) → zTranslate(u, Y) → aIf(togP ≟ 1, "Hide parametric curve", "Show parametric curve") → ShowCurveTextfield(α) → AlphaInputCurveCartesian((2 * cos((ω_1 * t) + α)) + (4 * cos((ω_2 * t))), (2 * sin((ω_1 * t) + α)) + (4 * sin((ω_2 * t))), t, 0, 6.2831853072) → eIf(Tr ≟ 1, "Clear Traces", "Show Traces") → ClrShwTraces
AI Drawing Prompt Reference
Draw a dynamic vector sum trajectory: two concentric circles centered at the origin with radii 2 and 4. From the center, two rotating vectors of lengths 2 and 4 emanate; the shorter one has an initial phase angle, the longer rotates uniformly. Translate the shorter vector to the tip of the longer so they join head-to-tail, and the endpoint of their sum traces a parametric curve over time. The curve is formed by adding the horizontal and vertical components of the two circular motions. Use sliders to adjust the two angular speeds and the initial phase, and observe closed or open curves for different frequency ratios. A checkbox toggles trace display and clearing.
The prompt above was compiled from the original drawing commands and is for reference only.