
The Sound of a Sine Wave Visualization
Loading the math board and drawing, please wait…
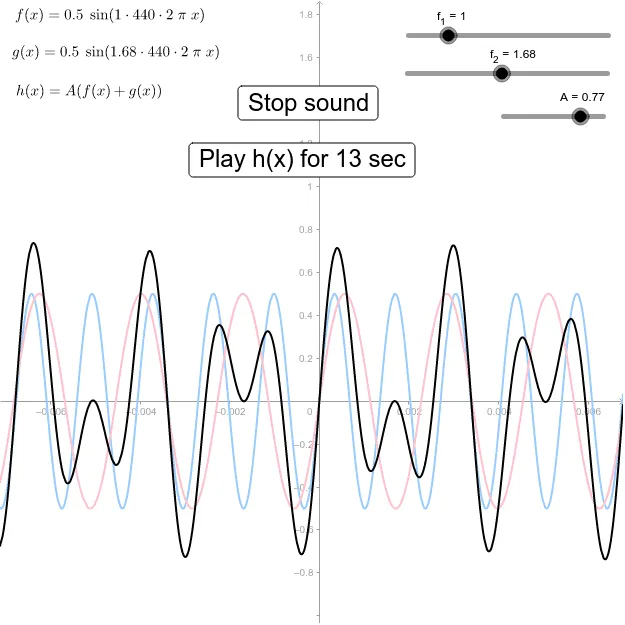
This example demonstrates the visualization of the sound of a sine wave. It involves core mathematical concepts such as sine functions, rhombuses, surfaces, circles, and step functions. The construction uses GeoGebra commands/objects like f_1, f_2, g, f, A, h, button1, button2, text1, text2, text3. It is suitable for high school and above students to learn about trigonometric functions and the relationship between sound waves.
GeoGebra Commands & Parameters
Numeric f_1(1.0)Numeric f_2(1.68)g(x) = (0.5 * sin(((((f_2 * 440) * 2) * π) * x)))f(x) = (0.5 * sin(((((f_1 * 440) * 2) * π) * x)))Numeric A(0.77)h(x) = (A * (f(x) + g(x)))
AI Drawing Prompt Reference
Create a mathematical function visualization showing two distinct sine waves with different frequencies and their superposition. The coordinate system should display two independent sine curves representing sound waves of varying frequencies, both with the same amplitude but different waveforms. Then combine these two curves using a coefficient of 0.77 to produce a third composite curve. The overall display illustrates how sound waves interact through sine wave superposition, demonstrating the application of trigonometric functions in acoustics.
The prompt above was compiled from the original drawing commands and is for reference only.