
The Linear Function f(x)=mx+b: Graph and Parameter Exploration
Loading the math board and drawing, please wait…
In collections
Quadratic Equation
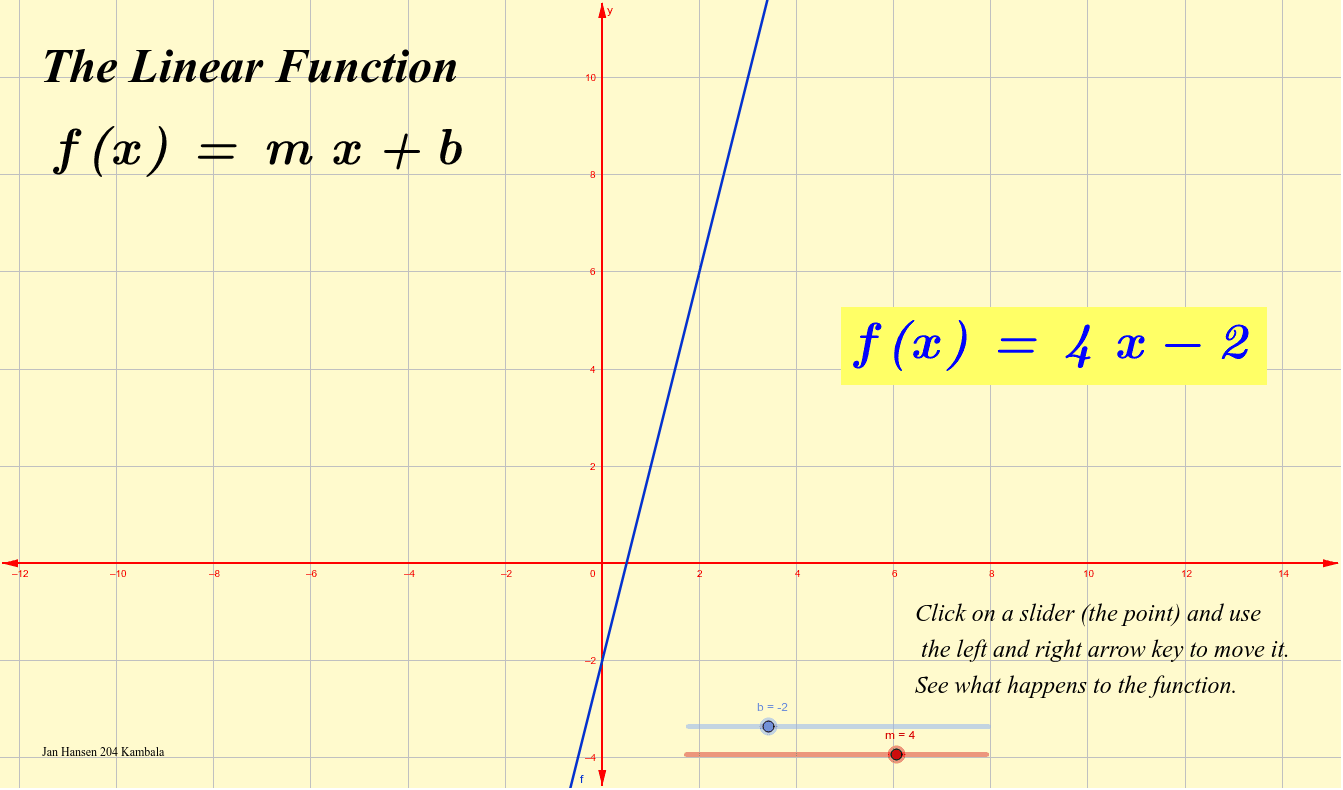
This GeoGebra example demonstrates the graph of the linear function f(x)=mx+b, allowing users to dynamically adjust the slope m and y-intercept b to observe how the line changes in the coordinate plane. Core mathematical concepts include linear functions, slope, intercept, and the relationship between the algebraic equation and its geometric representation. The construction uses LaTeX commands to input the function expression, and creates objects b, m, f, along with text labels text1 through text5 to display parameter values and the function formula. It is suitable for middle school and high school students learning function graphing and coordinate geometry, as well as for teachers to illustrate how parameters affect the line's position and steepness in classroom demonstrations.
GeoGebra Commands & Parameters
LaTeX(f, true, true) → text1LaTeX(f, false, true) → text3
AI Drawing Prompt Reference
Draw the graph of a linear function f(x)=mx+b with adjustable sliders for slope m and y-intercept b, showing how the function graph changes with parameter variations. Plot the function in a coordinate plane and include text labels to display the function expression and the values of parameters m and b, to observe the effect of parameters on the line's position and steepness.
The prompt above was compiled from the original drawing commands and is for reference only.