
The Cosine and the Unit Circle: A Geometric Visualization
Loading the math board and drawing, please wait…
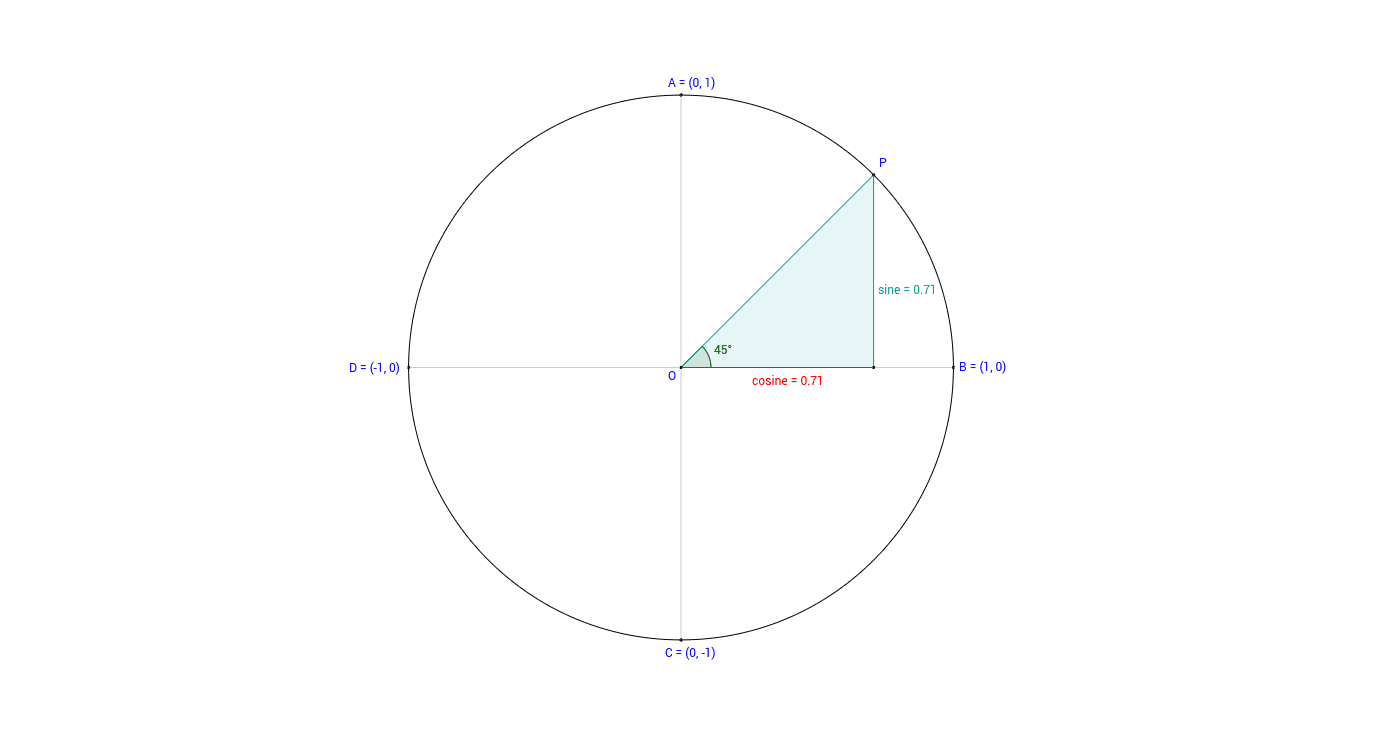
This GeoGebra applet provides a dynamic visualization of how the cosine function varies as the central angle changes on the unit circle. The core mathematical concepts covered include the unit circle definition of trigonometric functions, the periodic nature of the cosine wave, and the geometric projection of a rotating point onto the Cartesian axes. Constructed using key GeoGebra commands such as Circle, Segment, OrthogonalLine, Polygon, and Angle, the model builds a robust geometric skeleton. It uses intersection points and auxiliary polygons (like poly1) to map the angular parameter α directly to the cosine curve (cosine). This interactive tool is ideal for high school and introductory college-level trigonometry courses, helping students bridge the gap between geometric definitions and algebraic function graphs through visual, hands-on exploration.
GeoGebra Commands & Parameters
Intersect(xAxis, yAxis) → OPoint(xAxis) → BCircle(O, B) → gPoint(g) → AIntersect(g, xAxis, 2) → DSegment(D, B) → aPoint(g) → PSegment(P, O) → eOrthogonalLine(P, a) → bIntersect(b, a) → ESegment(P, E) → sineSegment(E, O) → e_2Polygon(O, E, P) → poly1, cosine, o_1, e_1Intersect(g, yAxis, 1) → CSegment(A, C) → iSegment(O, B) → hAngle(B, O, P) → α
AI Drawing Prompt Reference
Draw a unit circle and dynamically show how the angle α changes affect the cosine value. Start by drawing the intersection point O of the x-axis and y-axis, then draw the unit circle g with O as the center and B as the radius. Next, take point A on circle g and draw segment AD connecting A to the intersection of g with the x-axis, then draw segment DB. Then, take point P on circle g and draw segment PO, and construct the perpendicular line b from P to AD, which intersects AD at point E. Draw segment PE and OE. Use points P, E, and O to form polygon poly1, which represents the cosine curve. Finally, draw segment AC connecting the intersection of g with the y-axis and A, and segment OB connecting O and B, and label the angle α.
The prompt above was compiled from the original drawing commands and is for reference only.