
Temperature Scatter Plot
Loading the math board and drawing, please wait…
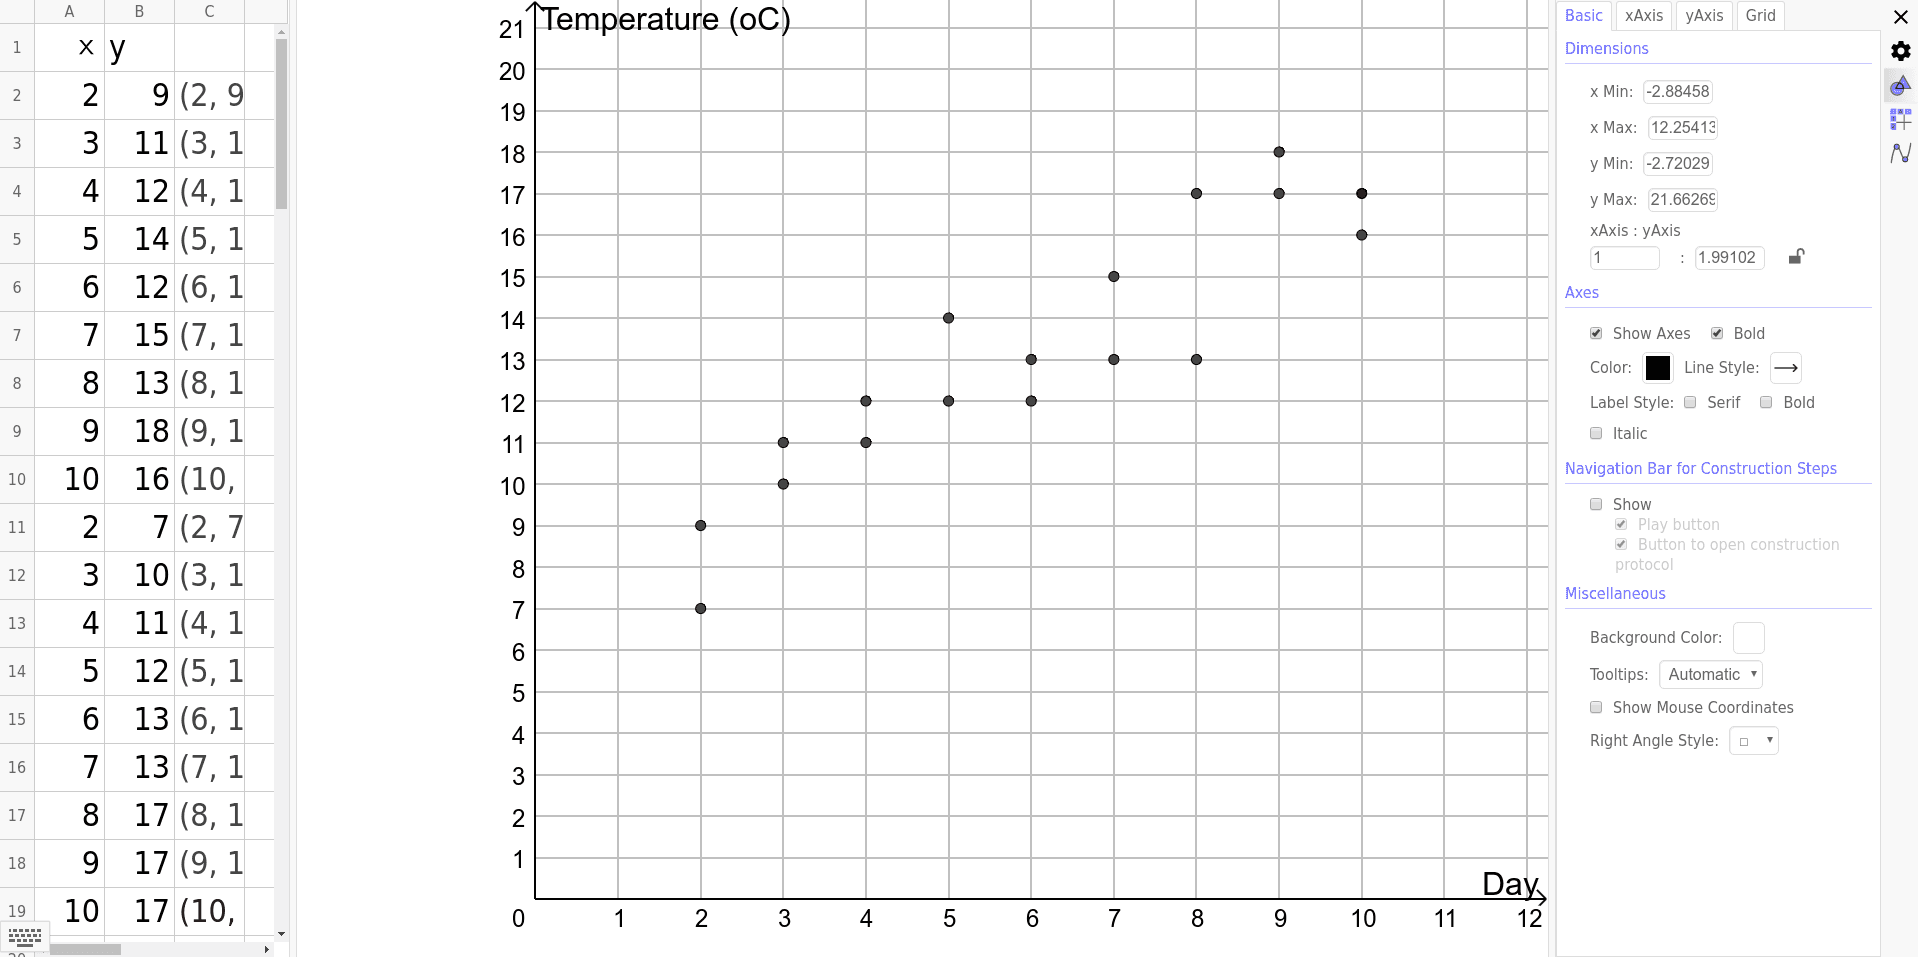
This example demonstrates a scatter plot of temperature over time. Key mathematical concepts include stochastic processes in statistics and coordinate geometry. Using GeoGebra commands such as point creation and coordinate representation, the temperature data trends can be dynamically displayed. Suitable for high school and above students to learn data statistics and stochastic processes.
GeoGebra Commands & Parameters
(3, 18)A1(x) = x234567891016181315911121412(A2, B2)(A3, B3)(A4, B4)(A5, B5)(A6, B6)(A7, B7)(A8, B8)(A9, B9)(A10, B10)23456789107(A11, B11)10(A12, B12)11(A13, B13)12(A14, B14)13(A15, B15)13(A16, B16)17(A17, B17)17(A18, B18)17(A19, B19)