
Tape Diagrams Session 2: Quadratic Functions and Optimization
Loading the math board and drawing, please wait…
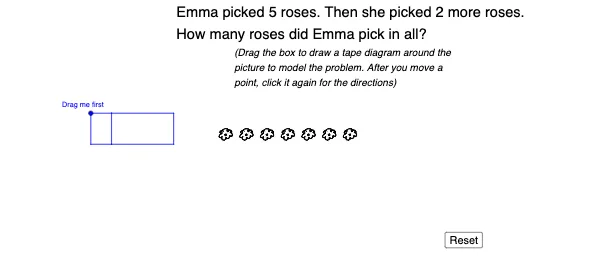
① This example uses tape diagrams to visually demonstrate optimization problems involving quadratic functions, showing how to explore maxima or minima under geometric constraints. ② Core mathematical concepts include quadratic functions, optimization, geometric mean, scatter plots, and line segments, integrating function graphs with geometric objects. ③ Construction highlights: Based on the summary, GeoGebra commands such as Point, Segment, OrthogonalLine, Intersect, and If are used, creating multiple points (A, B, C, D, etc.), segments, perpendicular lines, intersections, and conditional objects, along with functions f, g, h, text labels (text3, text4), and rose curves (Rose1 to Rose5) as auxiliary visuals. ④ Suitable for high school or pre-university students to grasp the geometric meaning of quadratic extrema, and for teachers to demonstrate intuitive solutions to optimization problems using dynamic geometry software.
GeoGebra Commands & Parameters
Point(Circle[R, 1.5]) → QSegment(R, Q) → fOrthogonalLine(R, f) → gOrthogonalLine(Q, f) → hPoint(g) → SPoint(g) → TOrthogonalLine(S, g) → iOrthogonalLine(T, g) → jIntersect(i, h) → UIntersect(j, h) → VSegment(R, Q) → kSegment(Q, U) → lSegment(U, V) → mSegment(V, T) → nSegment(T, S) → pSegment(S, R) → qSegment(S, U) → rIf(m2 ≟ 1, true, false) → ShowM2If(m3 ≟ 1, true, false) → ShowM3If(m1 ≟ 1, true, false) → ShowM1
AI Drawing Prompt Reference
Draw a diagram illustrating a geometric optimization problem involving a quadratic function, showing how to explore maxima or minima under geometric constraints. Include a line segment with two perpendicular lines intersecting it, forming multiple points. Connect these points to create a closed shape. Add rose curves and text labels as auxiliary visuals to represent geometric mean, scatter plots, and line segments, highlighting key concepts.
The prompt above was compiled from the original drawing commands and is for reference only.