
Tape Diagrams for Reasoning About Equations (IM 7.6.3 Practice)
Loading the math board and drawing, please wait…
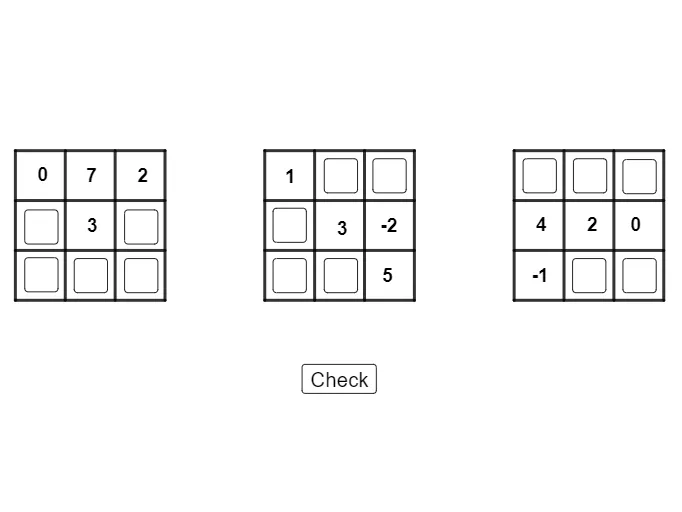
This example demonstrates how to use tape diagrams to represent unknown quantities as segmented lengths, enabling students to reason about and verify equalities visually. Key mathematical ideas include equation reasoning with variables, interpreting algebraic quantities as geometric lengths, and using structure/partitioning to make equality relationships clear (length/quantity conservation). Construction focuses on GeoGebra’s basic tools: Segment, Point, and Textfield. Points such as A, B, C, D, E, F, and many labeled parameters are used to build the segmented “tape” layout, while text fields label variables and relationships across the diagram. Suitable for middle school learners practicing solving/understanding equations via diagrams, and for classroom exploration of algebra-to-visual modeling.
GeoGebra Commands & Parameters
Segment(A, B) → fSegment(B, C) → gSegment(C, D) → hSegment(D, A) → i_{2}Point(f) → EPoint(h) → FSegment(E, F) → j_{2}Point(f) → GSegment(G, H) → k_{1}Point(i_{2}) → IPoint(g) → JSegment(I, J) → lPoint(i_{2}) → KPoint(g) → LSegment(K, L) → mSegment(M, N) → nSegment(N, O) → pSegment(O, P) → qSegment(P, M) → rPoint(r) → QSegment(Q, R) → sPoint(r) → SSegment(S, T) → tPoint(n) → UPoint(q) → VSegment(U, V) → aPoint(q) → WPoint(n) → ZSegment(W, Z) → bSegment(A_1, B_1) → cSegment(B_1, C_1) → dSegment(C_1, D_1) → eSegment(D_1, A_1) → f_1Point(f_1) → E_1Point(d) → F_1Segment(E_1, F_1) → g_1Point(f_1) → G_1Segment(G_1, H_1) → h_1Point(c) → I_1Point(e) → J_1Segment(I_1, J_1) → i_1Point(e) → K_1Segment(K_1, L_1) → j_1Textfield(i1) → InputBox1Textfield(i2) → InputBox2Textfield(i3) → InputBox3Textfield(i4) → InputBox4Textfield(i5) → InputBox5Textfield(j1) → InputBox6Textfield(j2) → InputBox7Textfield(j3) → InputBox8Textfield(j4) → InputBox9Textfield(j5) → InputBox10Textfield(k1) → InputBox11Textfield(k2) → InputBox12Textfield(k3) → InputBox13Textfield(k4) → InputBox14Textfield(k5) → InputBox15