
Tape Diagrams for Algebra Examples by artipal81 (2)
Loading the math board and drawing, please wait…
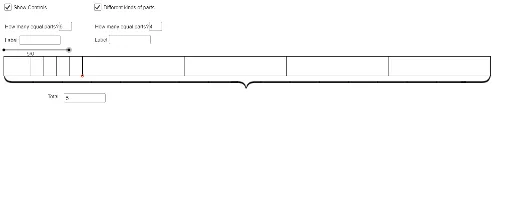
This example uses tape diagrams to demonstrate algebraic problems, involving linear and quadratic equations. By dragging sliders, users can dynamically adjust parameters and observe changes in the solutions. Commands used include Textfield, Polygon, Point, Segment, Midpoint, Sequence, etc. Suitable for middle and high school students learning algebra and geometry.
GeoGebra Commands & Parameters
Textfield(m) → InputBox1Textfield(text5) → InputBox2Textfield(n) → InputBox3Textfield(text6) → InputBox4Textfield(text7) → InputBox5Polygon(A, B, C, D) → poly1, a_1, b, c, dPoint(poly1) → ESegment(E, F) → fMidpoint(D, F) → GMidpoint(F, C) → HSequence(Segment[A + ((i_1 * (k - 1)), 0), A + ((i_1 * (k - 1)), h)], k, 1, m) → list1Sequence(Segment[E + ((i_2 * (p - 1)), 0), E + ((i_2 * (p - 1)), h)], p, 1, n) → list2Sequence(Segment[A + ((i_3 * (k - 1)), 0), A + ((i_3 * (k - 1)), h)], k, 1, m) → list3Sequence(Text[text6, (x(E) + (r * i_2) + i_2 / (n + 1), 0.7)], r, 0, n - 1) → list2tSequence(Text[text5, (x(A) + (q * i_3) + i_3 / (m + 1), 0.7)], q, 0, m - 1) → list3tSequence(Text[text5, (x(A) + (q * i_1) + i_1 / (m + 1), 0.7)], q, 0, m - 1) → list1tSegment(I, L) → i