
Tangent Function Graphing Exercise
Loading the math board and drawing, please wait…
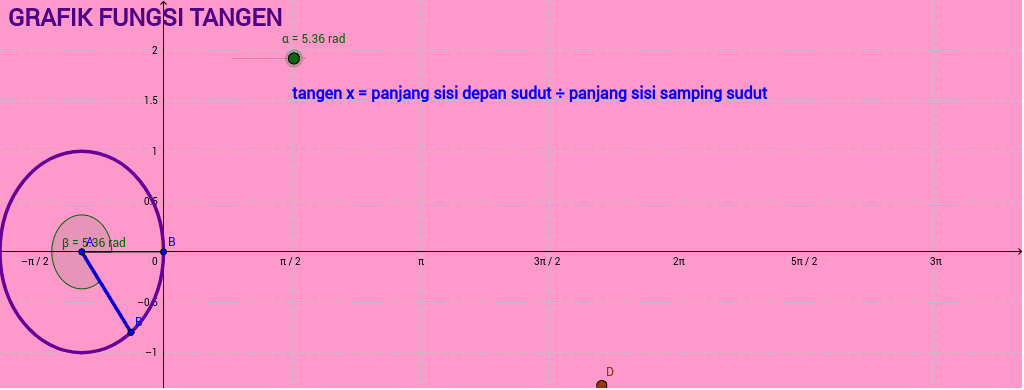
This example demonstrates the graph of the tangent function. It involves key mathematical concepts such as trigonometric functions and coordinate geometry. Using GeoGebra commands like Segment, Circle, Rotate, and Angle, the tangent function graph can be constructed. Suitable for high school mathematics education and learning.
GeoGebra Commands & Parameters
Segment(A, B) → aCircle(A, 1) → cRotate(B, α, A) → B'Segment(A, B') → dAngle(B, A, B') → β
AI Drawing Prompt Reference
Draw the graph of the tangent function. Start by drawing points A and B, then draw a circle with center A and radius 1. Rotate point B around point A to get point B', and then draw the line segment from A to B'. Finally, measure the angle BAB'.
The prompt above was compiled from the original drawing commands and is for reference only.