
T-shirt Sales Revenue Function Model
Loading the math board and drawing, please wait…
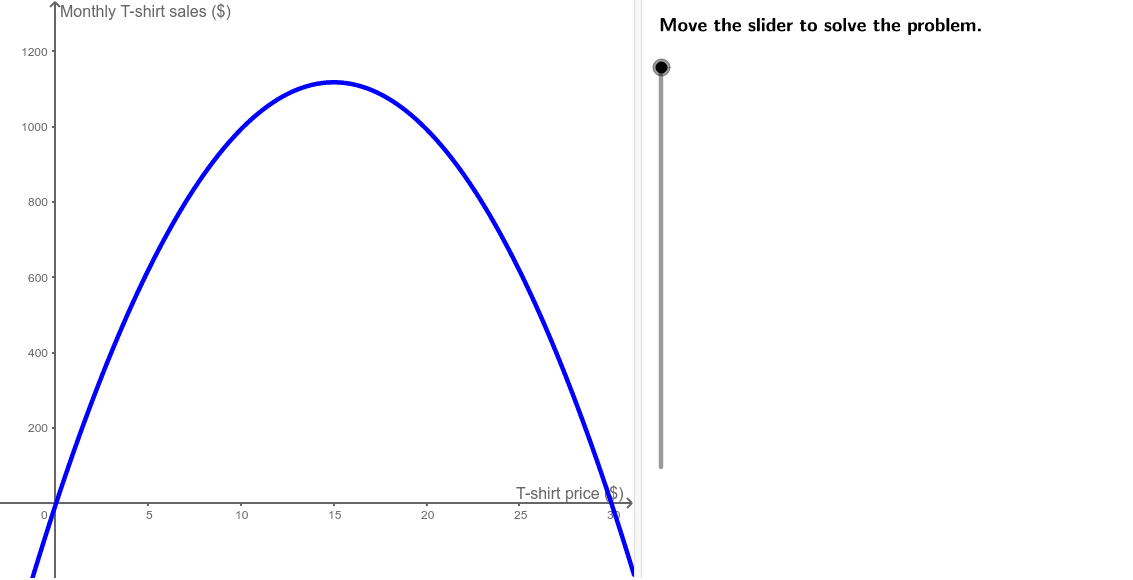
This example demonstrates how to use the quadratic function model [math]f(x) = –5x^2 + 150x – 7[/math] to describe the monthly revenue from T-shirt sales at a local store, and analyzes its vertex and revenue trends through graphing. Core mathematical concepts include quadratic functions, function graphs, vertex points, and analytical geometry. Key GeoGebra commands used in construction are Line, Simplify, Point, Max, Intersect, Coefficients, If, and Textfield. It is suitable for high school students to understand function modeling, graph analysis, and vertex optimization, ideal for introductory calculus education.
GeoGebra Commands & Parameters
Line((x(Corner[1]) + ((2 * indent) * screenwidth), 0), yAxis) → align1Line((x(Corner[1]) + ((3 * indent) * screenwidth), 0), yAxis) → align2Line((x(Corner[1]) + ((4 * indent) * screenwidth), 0), yAxis) → align3Simplify((a * x^(2)) + (b * x) + c) → fPoint(f) → AMax(f, -10000, 10000) → BIntersect(f, xAxis) → C, DSimplify(f((-x))) → pCoefficients(f) → list1Coefficients(p) → list2If(list1 ≟ list2, 1, If[list1 ≟ (-list2), 2, 3]) → evenoddTextfield(a) → inputBox1Textfield(b) → inputBox2Textfield(c) → inputBox3
AI Drawing Prompt Reference
Draw a graph of the quadratic function model f(x) = -5x^2 + 150x - 7 representing monthly T-shirt sales revenue, highlighting the function curve, vertex, and x-axis intersections. Include reference lines on the x-axis, plot the function, find the vertex and intersection points, and label the function equation and coefficients.
The prompt above was compiled from the original drawing commands and is for reference only.