
System of Inequalities Demo
Loading the math board and drawing, please wait…
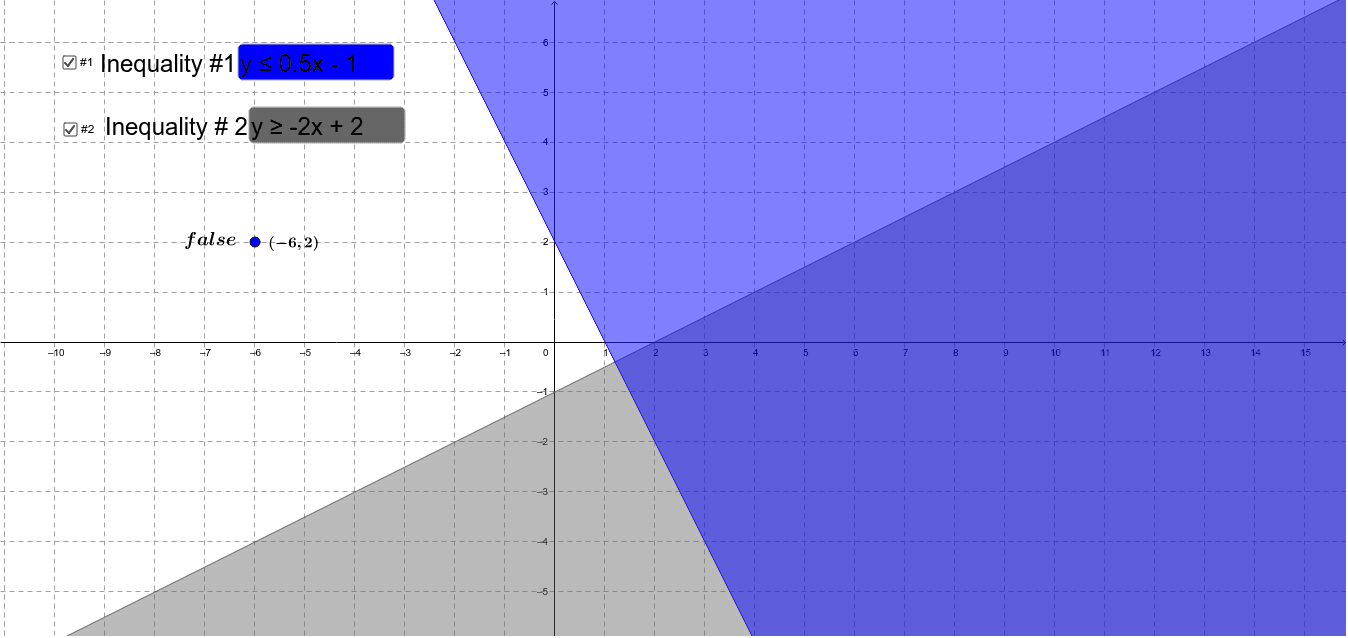
This example demonstrates how to plot the solution set of a system of inequalities in a coordinate system, observing the regions formed. Key math concepts include inequalities, area representation, linear function graphs, and intersections. Construction highlights involve using Textfield for text input, objects like a, b, c, d, e, f for parameters and points, inputBox1, inputBox2 for data entry, points A, g for defining key elements, and text1 to text6 for instructional labels. Suitable for high school students learning about inequality systems and their applications.
GeoGebra Commands & Parameters
Textfield(c) → inputBox1Textfield(e) → inputBox2