
Symmetry of Cosine Function Graph
Loading the math board and drawing, please wait…
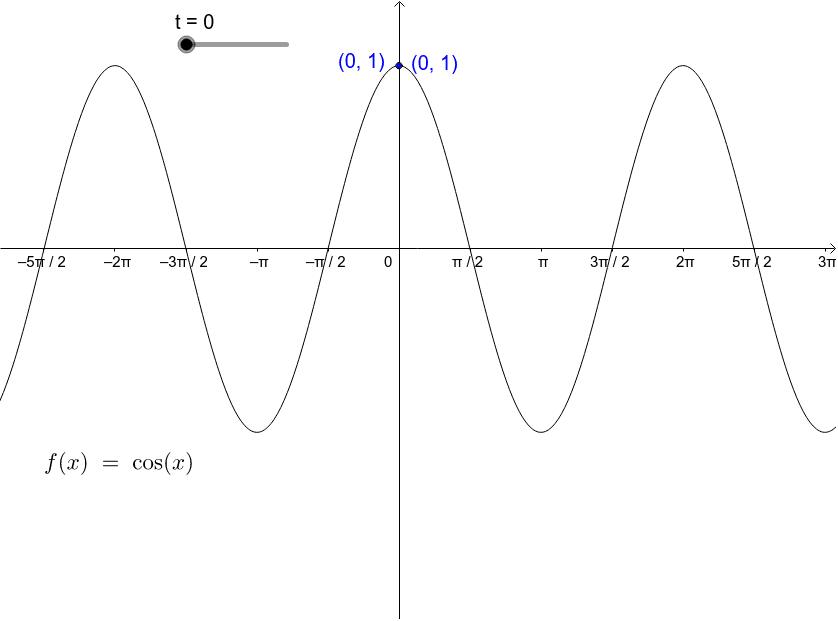
This example demonstrates the symmetry of the cosine function y=cos(x), specifically its symmetry about the y-axis. Key math concepts include trigonometric functions, function graph symmetry, and coordinate geometry. The construction uses GeoGebra commands like Segment to draw the function graph and related elements, involving objects such as function f, parameter t, points A and B, and slider a. It is suitable for high school students learning the properties of trigonometric function graphs to visually understand function symmetry.
GeoGebra Commands & Parameters
Segment(B, A) → a
AI Drawing Prompt Reference
Draw the graph of the cosine function y=cos(x) to illustrate its symmetry about the y-axis. Plot the curve on a coordinate plane, then select two points on the curve that are symmetric with respect to the y-axis. Connect these two points with a straight line segment, which should be vertical and bisected by the y-axis. Include a slider parameter to dynamically adjust the positions of the points, allowing visual exploration of the symmetry. The figure should show the coordinate axes, the cosine curve, the y-axis as the axis of symmetry, and the connecting segment, clearly demonstrating the even-function property.
The prompt above was compiled from the original drawing commands and is for reference only.