
Summative Algebra II Exponential Function Modeling 2018-2019
Loading the math board and drawing, please wait…
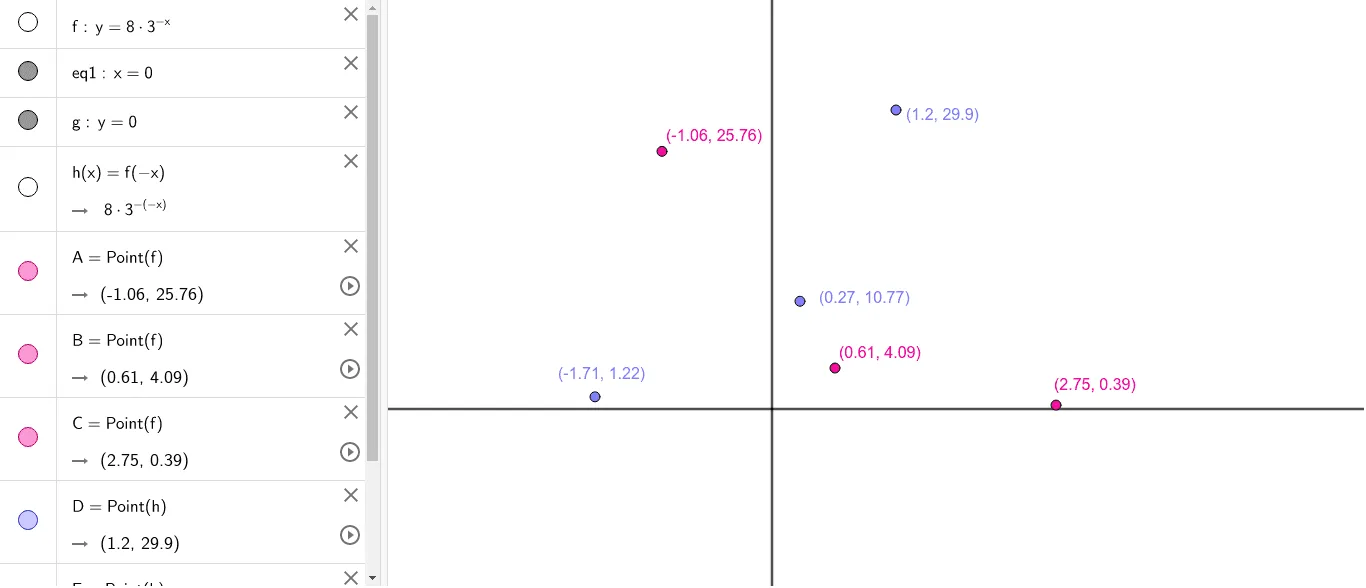
This example demonstrates how to model exponential functions using GeoGebra. Key mathematical concepts include exponential functions, function graphs, and frequency distribution. Using points, functions f, eq1, g, and h, and other GeoGebra commands, it shows how to create an exponential function model. Suitable for high school students studying exponential function modeling.
GeoGebra Commands & Parameters
Point(f) → APoint(f) → BPoint(f) → CPoint(h) → DPoint(h) → EPoint(h) → F
AI Drawing Prompt Reference
Draw a coordinate plane with two exponential curves, one above the other. Place three points on the upper curve and three points on the lower curve, spaced roughly evenly along each curve. Use solid lines for the curves and solid dots for the points, with moderate point size for clarity. The graph should show the growth or decay trend of exponential functions and highlight the correspondence between the curves and the selected points.
The prompt above was compiled from the original drawing commands and is for reference only.