
Stochastic Process & 3D Vector Visualization
Loading the math board and drawing, please wait…
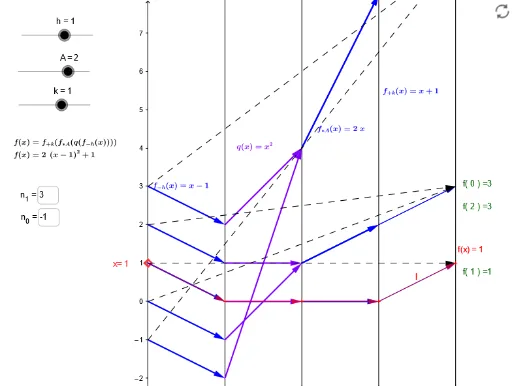
This example demonstrates the integration of stochastic processes with 3D vector graphics, dynamically visualizing the relationship between secant lines and pie charts. Core math concepts include 3D vectors, stochastic processes, function graphing, and probability & statistics. Construction highlights involve commands like Point, Vector, Sequence, Zip, and Textfield to build random vector sequences in 3D space, combined with secant and pie charts for data distribution. Suitable for high school and above mathematics education, illustrating the application of stochastic processes and 3D geometry.
GeoGebra Commands & Parameters
Point(yAxis) → A_1Vector(A_1, B) → uVector(B, C) → vSequence(n_0, n_1) → NZip(Vector[(6, m(q(R(i)))), (8, g(m(q(R(i)))))], i, N) → list1Zip(Vector[(4, q(R(i))), (6, m(q(R(i))))], i, N) → list2Zip(Vector[(0, i), (2, R(i))], i, N) → list3Zip(Vector[(2, R(i)), (4, q(R(i)))], i, N) → list4Zip(Vector[(0, i), (8, g(m(q(R(i)))))], i, N) → list5Textfield(n_0) → InputBox1Textfield(n_1) → InputBox2Zip(Text["f( " + (n) + " ) =" + (f(n)), (8.2, f(n)) + (0, ((-n) * 0.3))], n, N) → valTextVector(A_1, R_x) → wVector(R_x, QR_x) → dVector(QR_x, MQR_x) → jVector(MQR_x, GMQR_x) → lZip((A, f(A)), A, N) → GPts
AI Drawing Prompt Reference
Draw a 3D space with a sequence of random vectors, including vector u from point A to B and vector v from point B to C. Also, show a series of vectors generated randomly, connected by the function f(n) through points A and B, forming a series of points GPts. Additionally, display a dynamic pie chart and line chart to represent data distribution.
The prompt above was compiled from the original drawing commands and is for reference only.