
Describing Trends in Scatter Plots
Loading the math board and drawing, please wait…
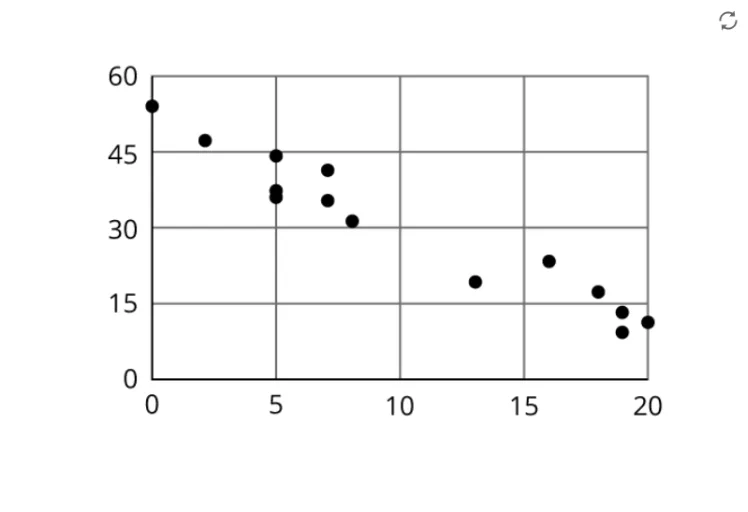
This example demonstrates how to describe trends in scatter plots, involving core math concepts like data analysis, trend identification, and correlation. It uses GeoGebra commands/objects A, B, and pic1 to create and display scatter plots, suitable for middle school mathematics teaching to help students understand data visualization.
GeoGebra Commands & Parameters
Point A(-12.587660802568553, -2.243737908557128)Point B(3.865161567958248, -2.243737908557128)
AI Drawing Prompt Reference
Draw a scatter plot with two points: one at (-12.587660802568553, -2.243737908557128) and another at (3.865161567958248, -2.243737908557128). Mark these points and connect them with a line. Ensure the plot is clear with labeled axes to show the position relationship between the points.
The prompt above was compiled from the original drawing commands and is for reference only.