
STEP Curve Sketching
Loading the math board and drawing, please wait…
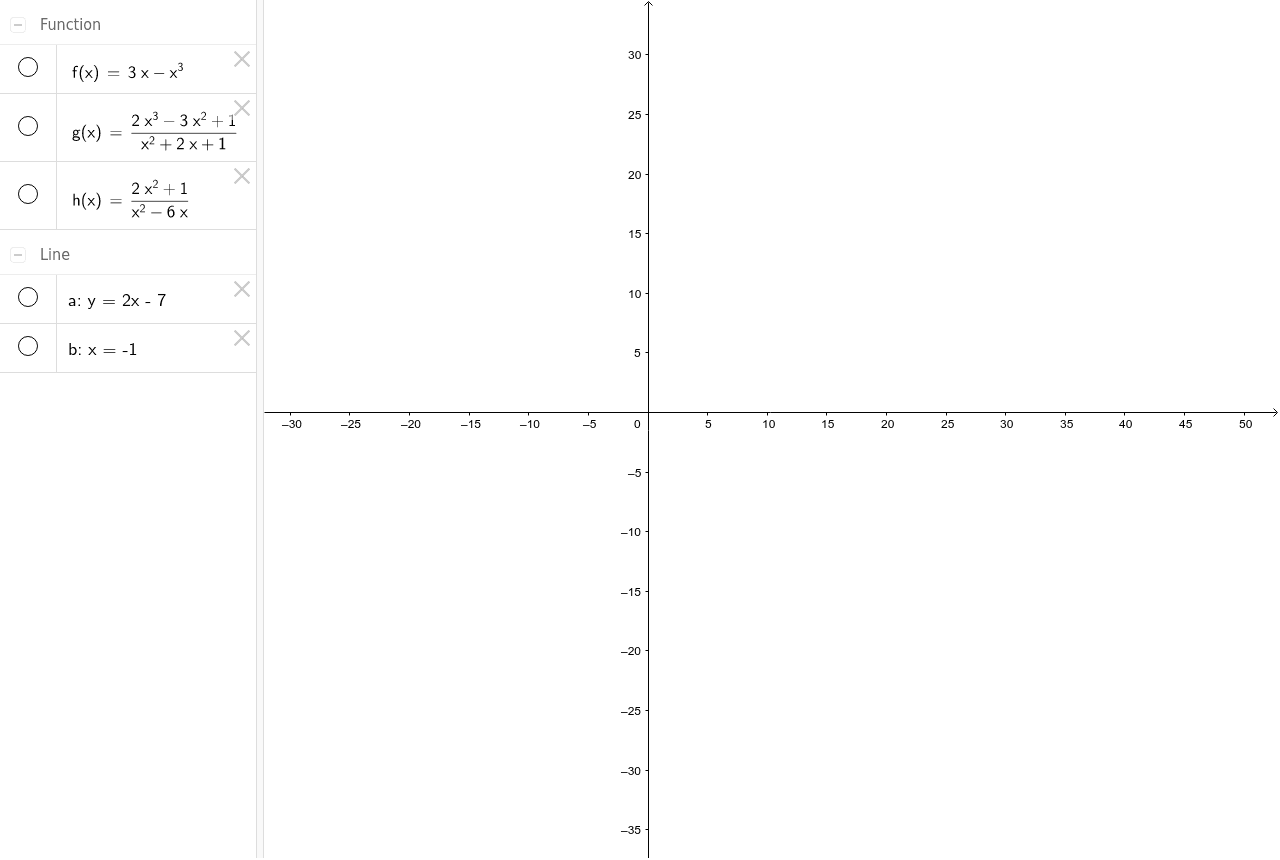
This example demonstrates how to use GeoGebra for sketching and exploring function graphs, involving exponentials, differential equations, and quadratic equations. By adjusting parameters a, b, h via sliders, observe the dynamic changes in functions f and g and similarity transformations. Core concepts include function graphs, derivatives, transformations, and coordinate geometry. Construction highlights the use of GeoGebra objects f, g, a, b, h, suitable for high school and above mathematics learning and function graph analysis.
GeoGebra Commands & Parameters
f(x) = (3 * x) - x^(3)g(x) = ((2 * x^(3)) - (3 * x^(2)) + 1) / (x^(2) + (2 * x) + 1)Line a(-2, 1, 7)Line b(1, 0)h(x) = ((2 * x^(2)) + 1) / (x^(2) - (6 * x))
AI Drawing Prompt Reference
Sketch two function graphs, one being a cubic polynomial minus an exponential function and the other a cubic polynomial divided by a quadratic polynomial. Show the dynamic changes and similarity transformations of these functions by adjusting parameters a, b, h. Add two reference lines, one from (-2,1) to (7) and another passing through the origin. Also plot a function graph of a quadratic polynomial divided by a linear polynomial, observing the intersections and trends of all functions to illustrate core concepts of function graphs, derivatives, transformations, and coordinate geometry.
The prompt above was compiled from the original drawing commands and is for reference only.